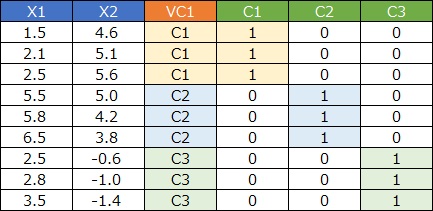
Vector quantization is a method of converting quantitative data into qualitative data by applying cluster analysis.
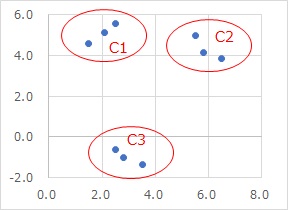
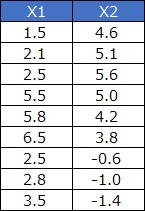
For example, suppose you have the following data: If you look at the scatter plot, it looks like there are three samples in each of the three areas.
It's hard to classify data manually like "the sample in the first row is here in the scatter plot", but cluster analysis makes that task easier.
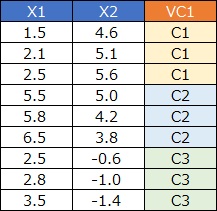
Vector quantization is the result of that work created as a new variable.
Efficient and effective approaches to convert multivariate problems (high dimensions) into small variate problems (low dimensions) and analyze them efficiently and effectively, such as visualization by compressing high dimensions into 2 dimensions, are well known.
Two-dimensional compression technology can also be compressed to one dimension, but in 1D, too much information is lost and often useless.
However, "compressing to one dimension is not good" is when compressing into quantitative variables. Vector quantization is a method of compressing high dimensions into one dimension, but into qualitative variables. If you make it qualitative, it will not contain information about the order between categories. This makes it impossible to handle data continuity, but instead it's a good way to "look at the data roughly."
If you use One-dimensional clustering for the same data as above, for example, it will look like the figure below.
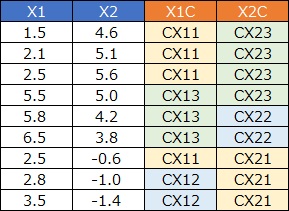
One column at a time is converted to qualitative variables. This has a use, and can be brought into the analysis of the similarity of individual categories, but "divided into three areas" is an inexpressible method.
Vector quantization seems to have been used as a method of compressing data in the field of communication. When I searched for literature, I found a lot of quite old ones related to communication.
Detailed numbers with infinite patterns in high dimensions can be converted into one-dimensional data with only as many clusters, so considerable compression is possible.
It can also be used as Feature Engineering when analyzing data.
First, there is a use even if it remains a qualitative variable, and it is Vector quantization label classification.
If you do a dummy transformation and convert it to a quantitative variable, you will have more uses. When performing logistic regression analysis with qualitative variables of interest, those using this method to preprocess explanatory variables are: It was listed in the following references. On This Site It is called "Cluster Enhanced Logistic Regression Analysis" and is introduced on the Logistic Regression Analysis page.
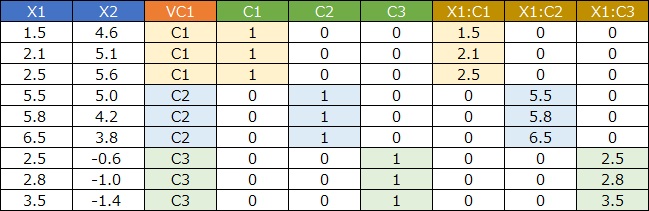
Creating an interaction term between a dummy variable and the original data has even more uses. Cluster Enhanced Regression uses this method as a preprocessing for explanatory variables. If the target variable is quantitative, it is more accurate to create an interaction term.
When I hear "how to make one dimension into a higher dimension", the author's feeling is "Is it possible to do that?" and "If it is possible, what is the use?" I'm tempted to think, The reason why I think so seems to be because I have a strong image of transforming quantitative variables. As for how to understand it, "If it remains a one-dimensional qualitative variable, numerical processing cannot be used, so it is converted to multidimensional before use. Even if it becomes multidimensional, the information contained is the same as the one-dimensional qualitative variable."
On the page "High-dimensional regression analysis using intervals by R", "Cluster high-dimensional regression analysis" is a pre-processing of the data by creating vector quantization, dummy transformation, and interaction terms.
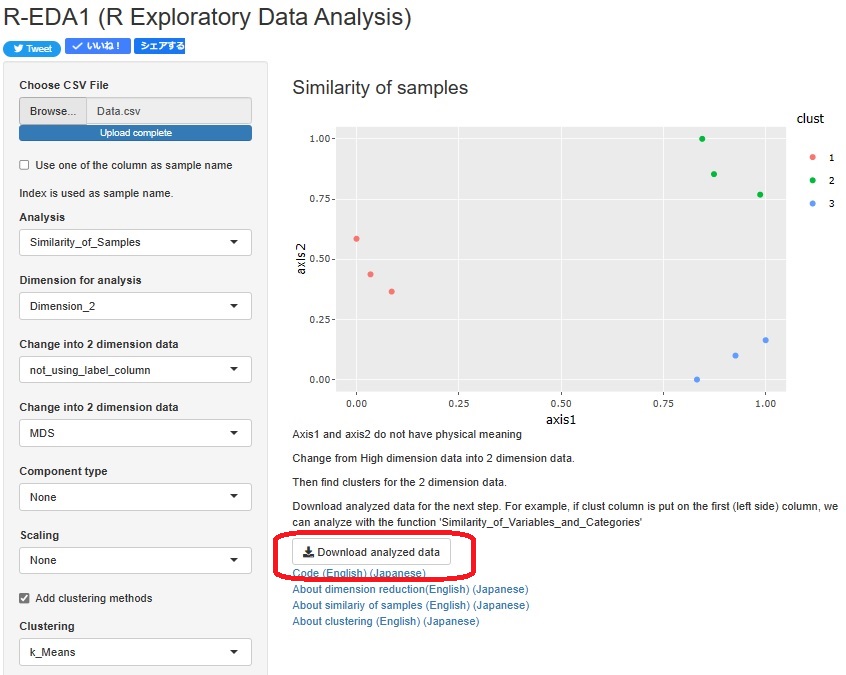
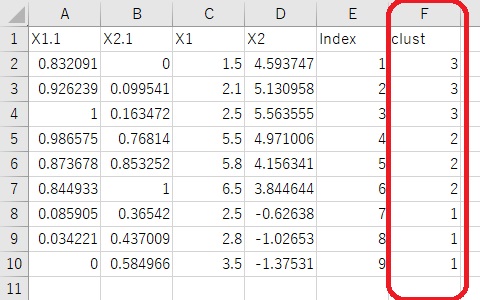
In R-EDA1, after cluster analysis, you can output data with the cluster number as a variable by pressing the button "Download analyzed data". To create a cluster, you can suddenly perform cluster analysis on the data, As shown in the figure below, there are two ways to compress high-dimensional data into two-dimensional data and then create a cluster.
NEXT  Differentiation Data and Integration Data
