This is an example of High-dimensional regression analysis using intervals by R.
High-dimensional regression analysis using intervals
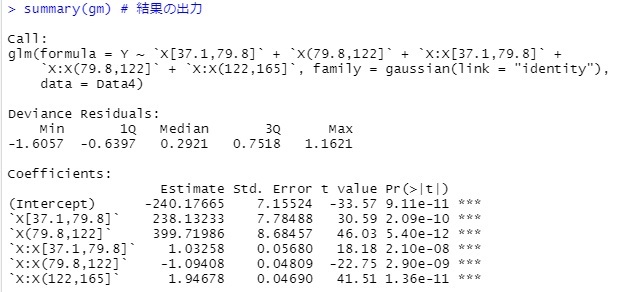
Another way to simplify your code is to use a generalized linear mixture model, such as the one in Generalized Linear Mixture Model with R, or an interaction model. However, using this method, the terms of the original data of x come into the model, making it difficult to understand the evaluation of the coefficients.
library(MASS)
library(dummies)
setwd("C:/Rtest")
Data <- read.csv("Data.csv", header=T)
Data1 <- Data
DataY <- Data
DataY$X <- NULL
Data1$Y <- NULL
DataX <- Data1
Data1[,1] <- droplevels(cut(Data1[,1], breaks = 3,include.lowest = TRUE))# Divide the quantitative variables in column 1 into three categories by one-dimensional clustering
Data2 <- dummy.data.frame(Data1)
Data3 <-Data2*DataX[,1]
colnames(Data3)<-paste0("X:",colnames(Data3))
Data4 <-cbind(DataY,Data2,Data3)
gm <- step(glm(Y~., data=Data4, family= gaussian(link = "identity")))
summary(gm)
library(ggplot2)
s2 <- predict(gm,Data4)
Data4s2 <- cbind(Data4,s2)
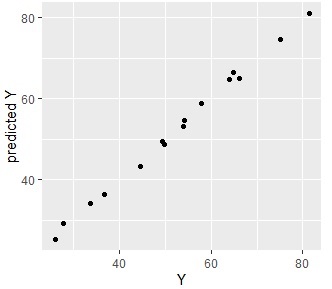
ggplot(Data4s2, aes(x=Y, y=s2)) + geom_point() + labs(x="Y",y="predicted Y")
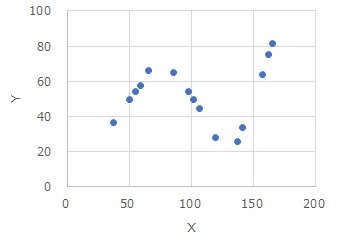
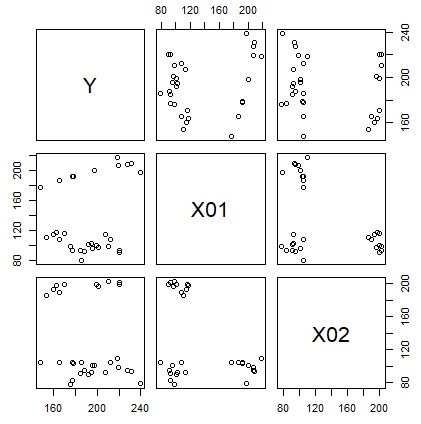
This example uses data from the Cluster Higher-Dimensionalization Regression page.
This example uses data from the Cluster Higher-Dimensionalization Regression page.
Here, the k-means method is used for cluster analysis. For other methods, you can refer to the Cluster Analysis with R page.
library(MASS)
library(dummies)
setwd("C:/Rtest")
Data <- read.csv("Data.csv", header=T)
Data10 <- Data
Data10$Y <- NULL
Data11 <- Data10
for (i in 1:ncol(Data10)) {
Data11[,i] <- (Data10[,i] - min(Data10[,i]))/(max(Data10[,i]) - min(Data10[,i]))
}
km <- kmeans(Data11,3)
cluster <- km$cluster
cluster <- as.character(cluster)
cluster <- as.data.frame(cluster)
cluster <- dummy.data.frame(cluster)
Data4 <-cbind(Data,cluster)
gm <- step(glm(Y~.^2, data=Data4, family= gaussian(link = "identity")))
summary(gm)
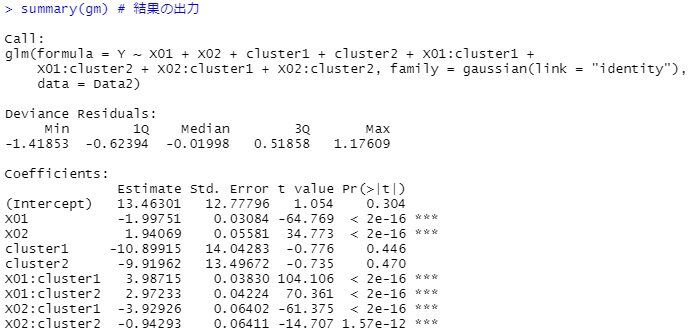
With this code, the model contains the original explanatory variables, which makes interpreting the results a bit cumbersome.
With this code, the model contains the original explanatory variables, which makes interpreting the results a bit cumbersome.
With this code, the model contains the original explanatory variables, which makes interpreting the results a bit cumbersome.
library(ggplot2)
s2 <- predict(gm,Data4)
Data4s2 <- cbind(Data4,s2)
ggplot(Data4s2, aes(x=Y, y=s2)) + geom_point() + labs(x="Y",y="predicted Y")
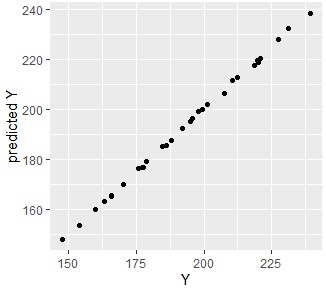
Since they are almost aligned, you can see that they are very accurate and predictable.
