Outlier detection with cluster analysis introduces Cluster Analysis for not just classifying data, but for grouping into groups called "outliers" .
There are other ways to search for "outlier" besides cluster analysis as one of Analysis of Similarity of Samples.
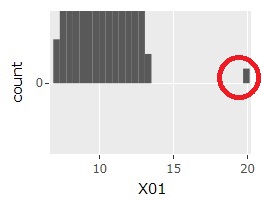
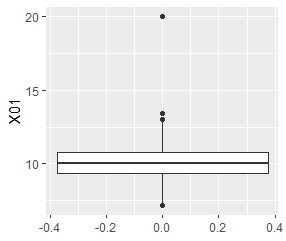
In one-dimensional data, basically, there is one distribution that contains the majority, and how far it is from both ends.
If you have more than one distribution that contains the majority and you want to find an isolated sample at the midpoint of those distributions, you can't find it with a boxplot or the Smirnov-Grabs test. Sometimes you can find it in the histogram, but it's hard to find. In this case, it is better to use the multidimensional data method.
You can find it in the Graphs of 1-Dimension Disribution.
Assuming a one-dimensional normal distribution, determine if the outermost sample of the distribution is an outlier.
In the case of multidimensional data, how to make the "outlier" visible depends on the method.
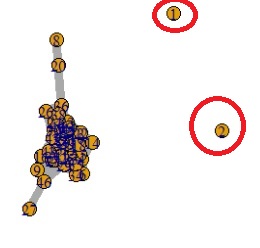
Visualization by compressing high dimensions into two dimensions shows , the isolated sample is an outlier sample.
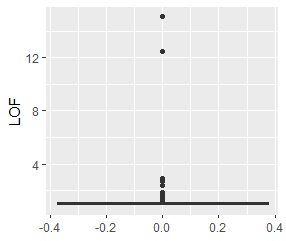
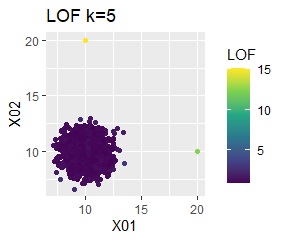
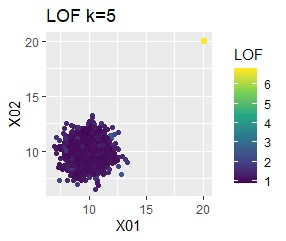
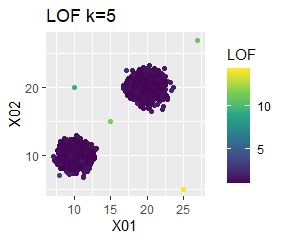
LOF is a kind of Neighboring method.
For multidimensional data, find out how far each sample is from nearby samples. As a result, you can also see which outliers are outliers.
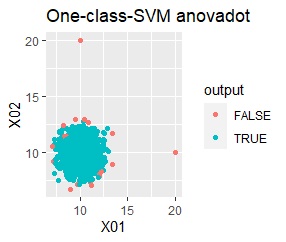
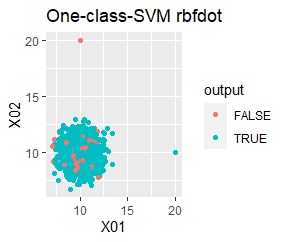
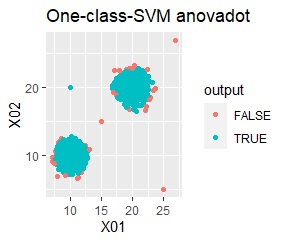
One-Class SVM can also be used to search for out-of-samples, but instead of "how to search for outliers", "how to group samples near the boundaries (edges) of groups to which many belong". Thinking about it seems to be the right way to go, with fewer mistakes.
The method of searching for out-of-samples starts the analysis without knowing which one is out of order.
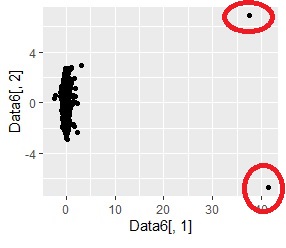
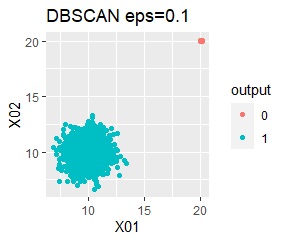
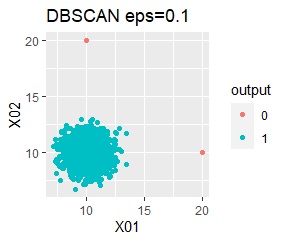
For example, in the figure below, the outliers are visible in the upper right, and the outliers (in this case, the group number is "0") can be found by detecting the outliers by cluster analysis . In this example, the four samples that are out of the way are so close that they cannot be seen in the graph.
In this example, the out-of-samples can be distinguished as expected, but when using the method of searching for out-of-samples, depending on the state of the data, the out-of-order samples cannot be detected as expected. I have.
Below is the code from the page for Outlier Detection by R.
For two-variable (two-dimensional) data, it summarizes how the difference in method appears for the difference in data. See if the outliers can be extracted in the same way with the cluster analysis method when making a scatter plot.
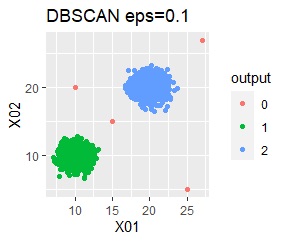
To make DBSCAN easier to use, the data is normalized and then analyzed.
If you write the conclusion first, it will be as follows.
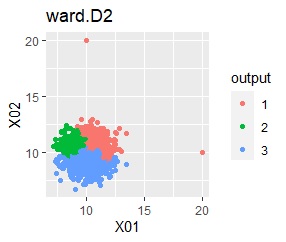
There is one group and two outliers.
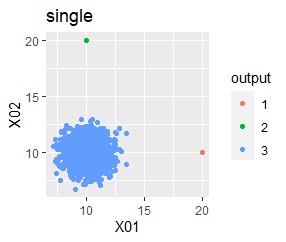
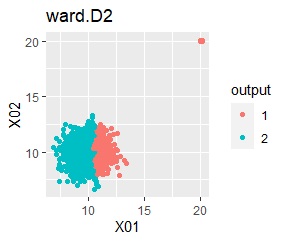
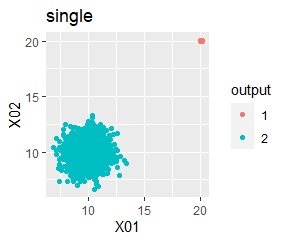
In the hierarchical type (ward.D2 and single), k = 3 assuming that one group and each outlier are a group.
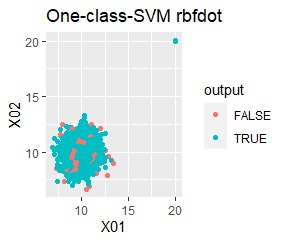
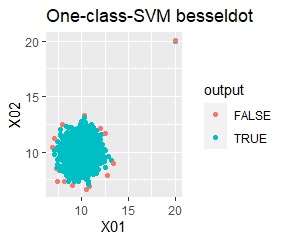
single, DBSCAN, and One-class-SVM besseldot are divided according to your wishes. LOF has a high value for off-samples. One-class-SVM anovadot looks good, but it may not work because there is a sample that is judged as FALSE a little inside the group.

There is one group and there are four outliers. The four outliers are so close that you can't tell from the graph.
In the hierarchical type (ward.D2 and single), k = 2 assuming that one group and each outlier are a group.
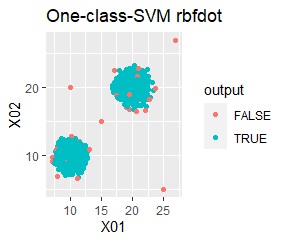
Single and DBSCAN are divided as expected. LOF has a high value for off-samples. One-class-SVM besseldot also looks good, but if you look closely, "TRUE" is mixed in the outliers. One of the four was wrongly judged.

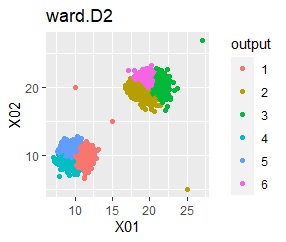
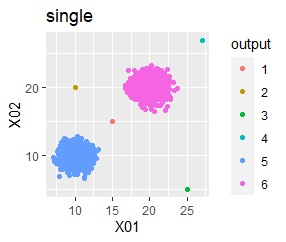
There are two groups and four outliers.
In the hierarchical type (ward.D2 and single), k = 6 is assumed, assuming that one group and each outlier are a group.
Single and DBSCAN are divided as expected.

There are pages Visualization by compressing high dimensions into two dimensions by R and Outlier Detectionby R.

