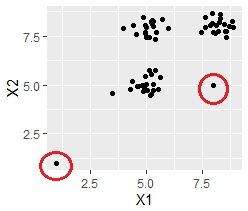
For example, suppose you have two outliers in addition to the three groups as shown in the figure below, and you want to retrieve these two as a separate group from the three groups.
The outlier model page explains how to mix the data you want to judge and the data you want to refer to, and how to not mix them, as how to use the data when judging the outliers.
You can use the hierarchical method and DBSCAN as a method to mix the data you want to judge and the data you want to refer to.
Regarding the k-means method, X-means method, and mixture distribution, there is nothing that can be understood that "it does not seem to belong to any group", so there may be situations where it can be used depending on how outliers are output. However, it is difficult to use.
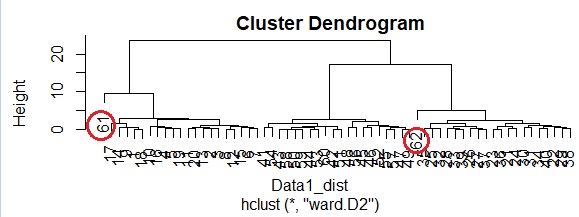
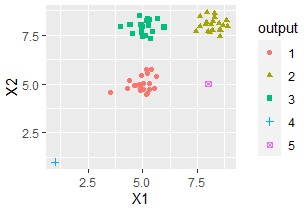
For example, the dendrogram of the data in the above example looks like this: The data for Nos. 61 and 62 are floating, so you can think of them as outliers. Since there are two outliers in addition to the three large groups, we thought that there would be a total of five outliers, and when we calculated the group with k = 5, we were able to create a group of outliers as intended.
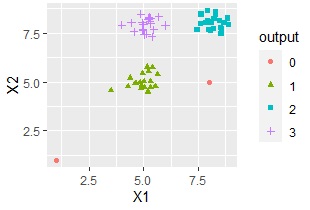
For DBSCAN, outliers fall into a group called group 0.
One-Class SVM is also use to detect outliers
NEXT  Prediction by cluster analysis
