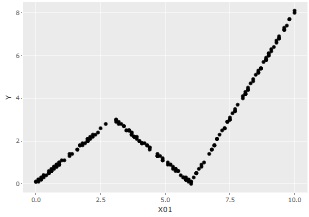
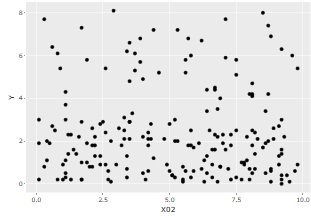
As above, suppose you have three variables, X01, X02, and Y, and Y and X01 have something like a relationship, but Y and X02 have irrelevant data.
The model tree is a mixture of Decision Tree( Regression tree ) and Regression Analysis . It is a method for automatically and heuristically performing regression analysis of Stratified Sampling.
In the decision tree, you can see the partial characteristics of the whole data, but you cannot consider it with mathematical formulas. Regression analysis is good when the whole data can be represented by a single formula, but otherwise it doesn't work. The model tree is a way to complement each other's weaknesses.
"General regression tree" here refers to the way Y is executed when it is a quantitative variable in rpart or random forest.
The method commonly known as regression tree is also called " ANOVA by stratification ". We will stratify (divide) the data to create groups and see if there is a difference in the average value of the groups.
By looking at the difference between the groups, you can see the difference between the higher and lower Y. However, within the same group, the predicted values are the same, so the predicted values ??are not very accurate. Finer groups improve the accuracy of the predictions, but make the model too complex to consider.
The model tree does regression analysis within the same group. This also allows you to express differences in values within a group.
Therefore, the accuracy of the predicted value is better than that of a general regression tree without having to subdivide the group.
A typical regression tree is labeled "regression", but unlike so-called regression analysis , it does not use an expression like
Y = a*X + b
.
On the other hand, in the model tree, we apply an expression such as
Y = a*X + b
in each group .
As above, suppose you have three variables, X01, X02, and Y, and Y and X01 have something like a relationship, but Y and X02 have irrelevant data.
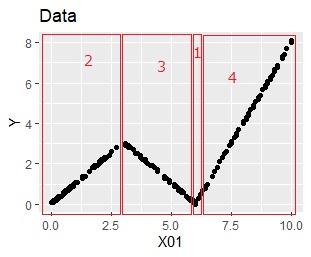
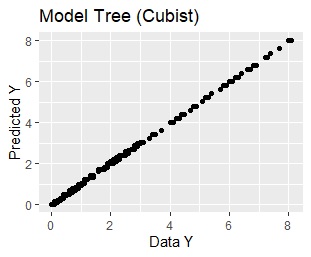
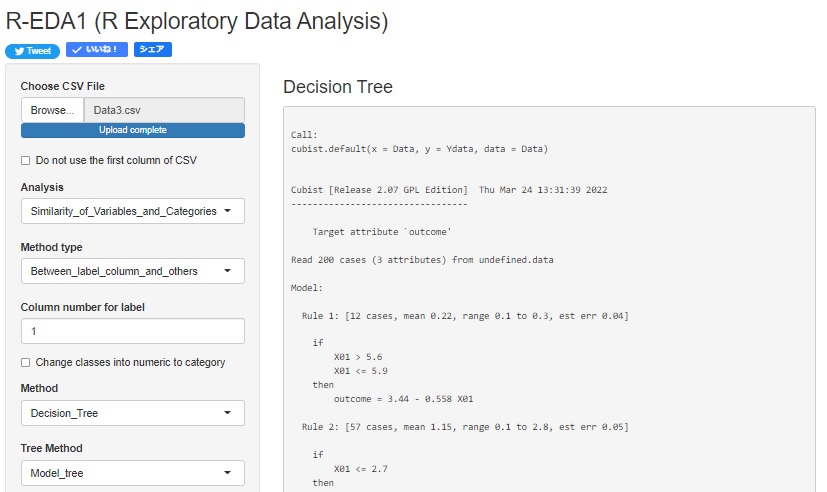
Analyzing this with a model tree, the model is as follows. It seems that it can be expressed by 3 groups, but 4 are extracted. Each of the four rules is the result of a simple regression analysis.
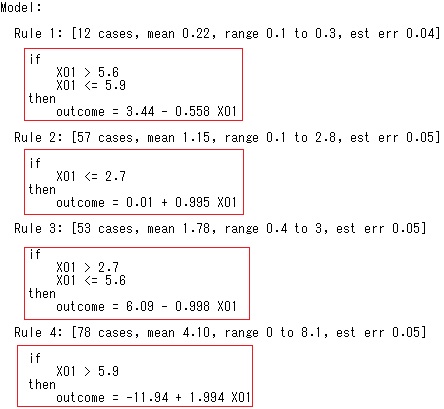
4 rules are same to the shape seen in the data.
Use this model to get the predicted value. In the graph below, the horizontal axis is Y of the original data and the vertical axis is Y of the predicted value. Since they are arranged in a straight line, you can see that a very high prediction is made.
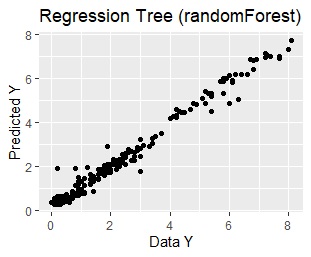
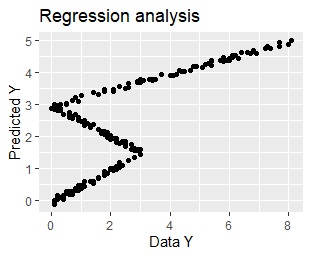
This is the result of using the same data. From the left, the regression tree of rpart, the regression tree of random forest, and the multiple regression analysis.
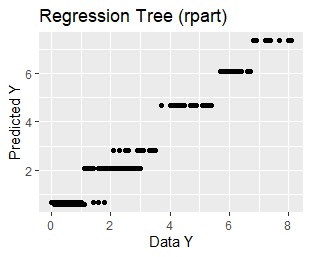
You can see from the graph that rpart has the same predicted value within the same group.
Random forest seems to be highly accurate, but the model is too complicated to consider the relationship between Y and X01 or X02. It doesn't lead to thinking about countermeasures using the model.
Multiple regression analysis cannot express that the suitable formula differs depending on the interval of X01, so the predicted value is far from practical.
The model tree by R is in the Decision tree by R.
You can also do it with R-EDA1 .
NEXT  Analysis of individual category grouping
