The mixed distribution MT method is a method of Prediction by cluster analysis.
This method can be used when the unit space (learning data) is a mixture distribution in which multiple normal distributions are superimposed.
MT method and Principal Component MT , since the theory that assumes a normal distribution, it may not fit the data. As a countermeasure, there are Kernel Principal Component MT method and One-Class SVM , but these are difficult to adjust the parameters, and even if they can be adjusted well, the accuracy is not good. The Mixture distribution MT is not as versatile as these methods, but it is much easier and more accurate than these.
The "mixture distribution MT" is a coined word of the author. I'd like to match the name of this method if there is an official document, but I haven't found it for the time being, so I chose this name.
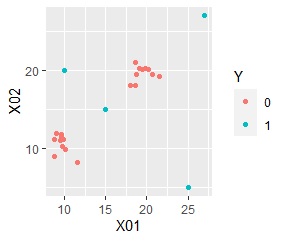
For example, suppose you have the following scatter plot data. The "0" in the red plot is divided into two groups, and the four "1" s in the blue plot are both separated from both of the two groups.
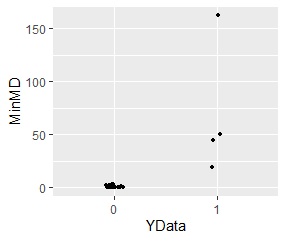
The following is an analysis using the mixture distribution method with "0" as the unit space. It is possible to quantitatively show how far the point "1" is from both of the two groups.
In the mixture distribution MT method, the unit space is first decomposed into individual normal distribution parts. This decomposition uses the mixture distribution method, which is also part of the Cluster Analysis . You can do something similar with the k-Means method.
Then calculate the Mahalanobis' Distance for each normal distribution . The Mahalanobis distance is defined by dividing by the number of variables used in the MT method. In the definition of the MT method, the same threshold value (number of judgment criteria) can be used as a guide even if the number of variables is different.
Thus, for one sample, the Mahalanobis distance from multiple normal distributions can be determined.
The normal distribution with the smallest of these multiple Mahalanobis distances is determined as the normal distribution to which the sample belongs. In addition, a minimum of Mahalanobis distance Unit Space if as far off than the distribution of the Mahalanobis distance of (data for learning), and determines that the sample is an outlier.
By the way, in the above algorithm, after the procedure of first performing cluster analysis and decomposing it into individual normal distributions, it is almost the same as the method of Discriminant Analysis using distance.
The reason why it is "almost the same" rather than "exactly the same" is that the Mahalanobis distance definition formula is slightly different, and the result is that "which normal distribution does it belong to?" Is a discriminant analysis. In the mixed distribution MT method, we try to see "how far is it from the nearest normal distribution?".
By the way, discriminant analysis and mixture distribution MT method can be used to replace the definition formula of Mahalanobis distance or to replace what you are trying to see.
There is a difference between the discriminant analysis and the MT method on the page of Difference of Good Distribution by Methods . Although it is complicated, the mixed distribution MT method is a type of discriminant analysis and a type of MT method by including cluster analysis in the pretreatment .
Example of R is in the page, Analysis of anomaly quantification by R.
NEXT  Decision of Abnormal by MT method
