Just as there is Prediction Interval of Regression Analysis, Regression analysis of Proportional variance also have Prediction intervals.
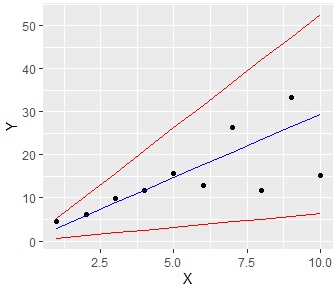
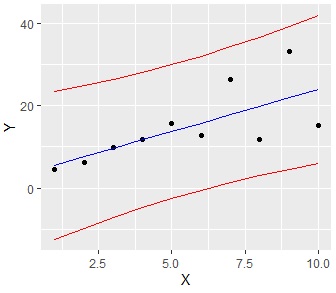
The graph below shows the case where the left side finds the prediction interval as a Proportional variance, and the right side finds the prediction interval as a normal regression analysis. For this data, it seems better to assume a Proportional variance.
The idea in this page is my own idea. Since it is a simple calculation, there may be previous studies, but I have not found it. If you know, I would appreciate it if you could tell me.
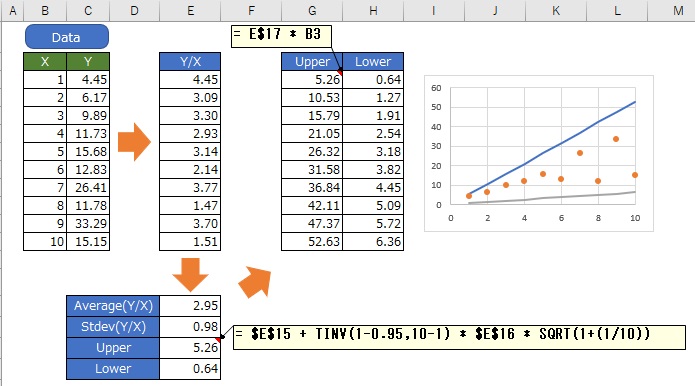
Suppose there is X and Y data.
Calculate Y/X and find the Average and standard deviation (Stdev), and the upper and lower prediction intervals for Y/X. Finally, multiply the Y/X prediction interval by X to get the Proportional variance prediction interval.
Instead of trying to find it directly from Y and X, By calculating Y/X, we find it by returning to the mechanism where the Proportional variance is once established.
The above example is made in EXCEL. It is a simple method, so we can do it even in EXCEL.
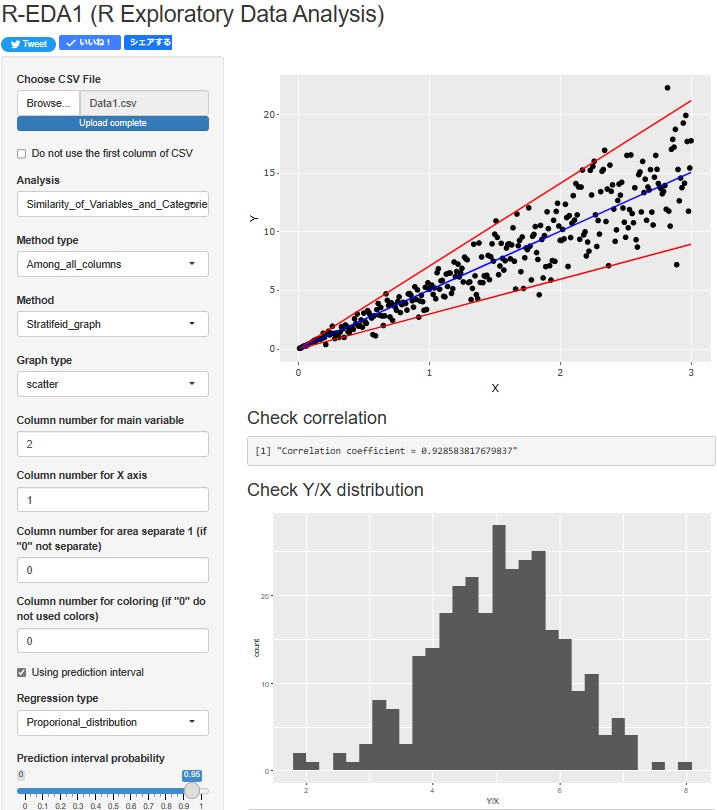
An example of R can be found on the Analysis of prediction interval by R page.
R-EDA1
has the funciton to analyze Proportional variances.
NEXT  Constant variance and Proportional variance
