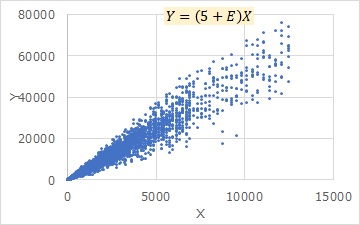
The graph below shows the same data for both left and right, and is Proportional variance. The difference between the left and right is the difference in the axis of the graph, and the left side uses the original data as it is. On the right is a graph with both the X and Y axes logarithmic (bilogarithmic graph).
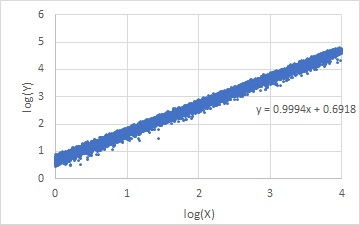
In this way, if you make both logarithmic, it looks like a distribution like equal variance (the variation from the regression line is equal in all Xs), so there is a relationship between proportional variance and equal variance. This page is about this relationship.
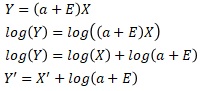
If we logarithm both sides, we get the equation above. The graph on the right above shows X' and Y' with such transformations.
Thus, logarithmically, the equation for proportional variance is close to that of a general regression analysis. (The only difference is that the log is included.) For this reason, proportional and equal variances can be mutually convertible.
By the way, this relationship is very similar to the relationship between Additive model and multiplicative model.
If you look at this transformation, you can see that We can see that X' and Y' have a slope of 1 and the Y intercept is log(a+E).
That is, no matter what the slope of the original proportional variance is, the slope of the relation equation for X' and Y' will be 1.
Also, the variation between the Y-intercept and the Y-axis is determined by log(a+E).
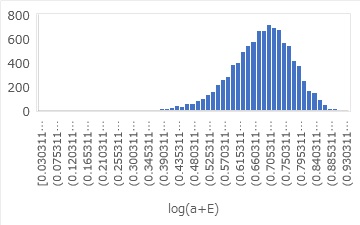
log(a+E) is the distribution shown above. In this case, it varies around the average value of 0.69. This mean value is the value of the Y-intercept. In the graph on the right above, you can see that the formula for the straight line has been calculated, and the Y intercept is 0.69.
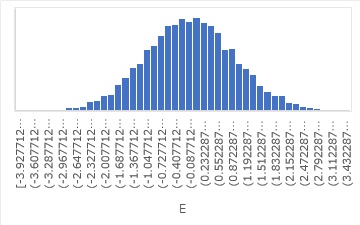
In the case of this data, the E part is shown in the figure below. It is normally distributed. It is also in Made by Normal Distribution But Not Normal Distribution, but in log, it is no longer symmetrical and the left side is longer.
If you convert to logarithms, the slope will always be 1, and you will not be able to analyze anything more. The point that the slope a at the time of proportional variance appears as a Y intercept after converting to logarithm is very difficult to interpret. It is good to be able to analyze equal variances, but after that, it is very difficult to proceed.
Therefore, I think that the best approach for regression analysis of proportional variance data is to calculate Y/X, as shown on the page Regression analysis of Proportional variance.
However, logarithms seem to make outliers easier to see, so there seems to be a use for it.
NEXT  Additive model and multiplicative model
