The Data Literacy page provides a brief explanation of connecting data. You will be able to analyze the relationships between various things that connect data.
The "linking" in the title of this page refers to connecting data.
The easiest way to link data is to use key items to link data in the same database. Well known in relational database . Also, with EXCEL, you can do it with the vlookup function.
When linking different types of data, it may not be possible to link them unless Feature Engineering is performed. In addition, feature quantity engineering greatly expands the range of analysis.
On this page, I tried to organize the way of thinking about the association of heterogeneous data, while also matching the scope of the conventional explanation.
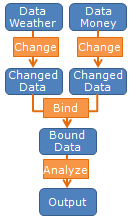
First of all, as a premise of the story on this page, the actual flow of data analysis is as shown in the figure. Here, I took an example of an analysis to investigate the relationship between temperature and sales.
Suppose that the temperature data and the sales data are from different sources. Suppose the temperature is hourly data and the sales are daily data.
In the case of such data, we will compare what we want to know by analysis with the contents of the data and decide what to do, but here we will also process the temperature into daily data. By doing this, you will be able to link the temperature data with the sales data.
Once the linked data is created, this is the so-called data analysis, and analysis results such as "sales are high on hot days" can be obtained.
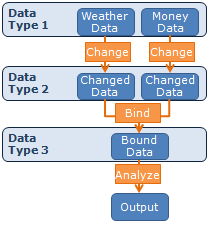
In the section of Sensor Data Analysis , I wrote about the data formats from 1st to 3rd, but the name of the data format also applies to the example on this page.
There seems to be a common misconception that "if I know techniques such as Statistics , Data Mining and Machine Learning , I can analyze data."
However, since these methods are effective methods when used for data in tabular form, it has become possible to analyze both data in different forms in the state of primary data. Is not ...
If you want to do this kind of analysis, you need to go into the form of tertiary data.
In the above, I wrote briefly that "the temperature is also processed into daily data", but it is necessary to consider how to put it together, such as "maximum value, average value, minimum value, ascending speed". In addition, it is necessary to consider whether to aggregate the entire 24-hour data for each hour, or to limit it to business hours and morning hours.
In this area, especially when creating secondary data, there are many variations for the purpose of actual data content and analysis, but it is not much talked about in the world. What is not talked about is that it cannot be expressed by smart theory and procedures, and it requires muddy work.
If you think about familiar numbers such as "temperature" and "sales", you may know how to process the data. However, when it comes to data output by machines and data obtained through advanced measurements, it is not always possible to understand the meaning of the data. You need to investigate or ask an expert.
Regarding the point that "there are as many variations as possible", "Isn't it better to put out all the patterns in today's computers and adopt the patterns that have the most explanatory power?" And " In the case of Artificial Intelligence , the best. Can you find a good pattern? "
However, the point here is the work of "defining" and "stabilizing" the scope of the problem, so I don't think it can be handled by artificial intelligence at least.
On this site, there is a page for Analysis of Type 2 (Feature Data) as an example when creating type 2 data for sensor data . This example can be used for time series data in general, rather than talking about any special kind of sensor data.
It's a complicated story that isn't straightforward, but if you go past this, the content that can be analyzed will expand.
NEXT  Database
