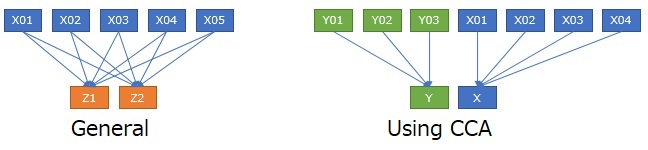
When compressing high dimensions to 2 dimensions in a regression analysis , it is divided into objective variables and other variables. The method on this page can be interpreted as if the target variable were a group of variables.
Regression analysis deals with relationships between one variable and multiple variables, but the method on this page deals with relationships between multiple variables. The way this can be done is Canonical Correlation Analysis .
<
We apply Canonical Correlation Analysis to the Visualization by compressing high dimensions into two dimensions.
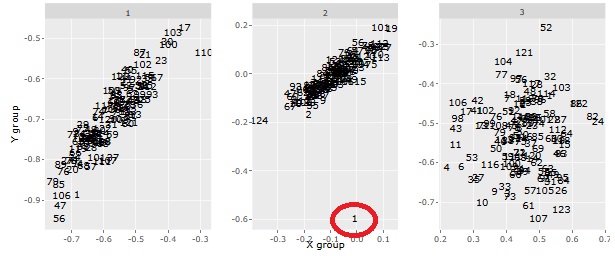
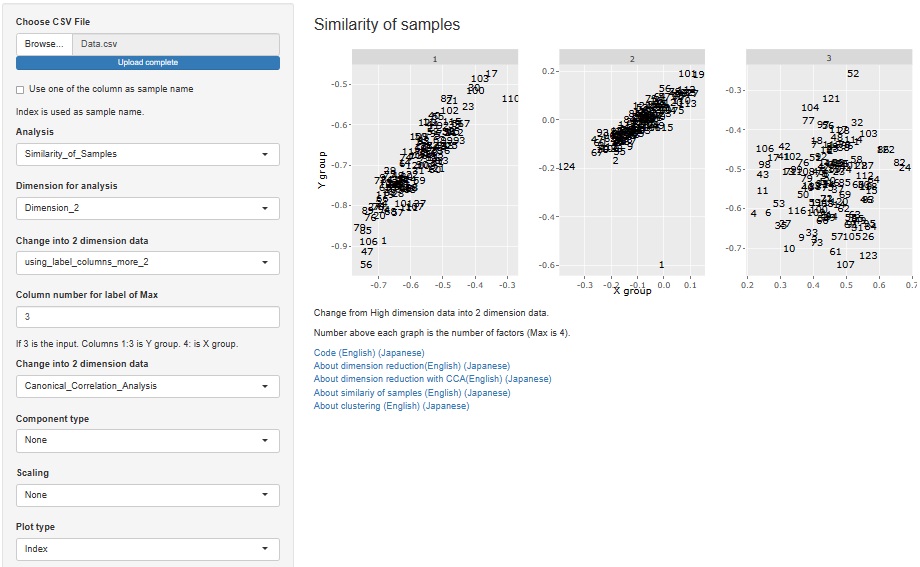
In the example below, from the left, the scatter plot between the first components, the scatter plot between the second components, and the scatter plot between the third components. The data I'm using is only the sample in the first row, and unlike the other samples, I'm using values ??that are entered appropriately, but in the scatter diagram in the middle, I can see that this sample is off. I'm here. Also, although there are three factors, we can see that there are only two factors that are highly correlated between the two groups.
In the method of visualizing by compressing high dimensions into two dimensions , it is normal to analyze with one scatter diagram, but when using canonical correlation analysis, it is an example that you can not understand unless you look at two or more.
R-EDA1 also allows nonlinear canonical correlation analysis.
Canonical Correlation Analysis by R
NEXT  Cluster Analysis
