Visualization by compressing high dimensions into two dimensions with regression analysis
The method of Visualization by compressing high dimensions into two dimensions is generally classified as a method of unsupervised learning.
The "regression analysis" in the title of this page is a supervised learning method in which the objective variable is quantitative data, typified by regression analysis. In Support Vector Machine and Decision Tree, when the objective variable is quantitative data, it is also a member of the regression analysis system.
The Regression Analysis method can be applied to the visualization method by compressing the high dimension into two dimensions.
Differences from common compression methods
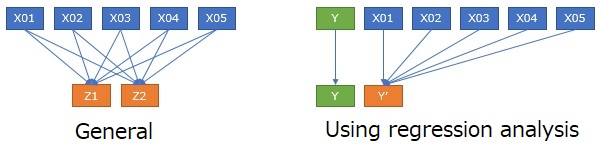
The general method of visualization by compressing high dimensions into two dimensions is on the left in the figure above. Do some kind of transformation to turn three or more variables into two. Two (two-dimensional) features can be seen. The way of conversion is the ingenuity of each method.
In the case of regression analysis systems, there is only one special one among the original variables: Y. For Y, nothing is converted. Transform only for variables other t
Differences in procedures
If you have a variable equivalent to Y and use the visualization method by compressing the higher dimension into two dimensions, First, the procedure is to compress variables other than Y and then analyze the relationship between the compressed variable and Y.
On the other hand, when compressing with a regression analysis system, analysis can be performed at the same time as compression.
Comparison of methods
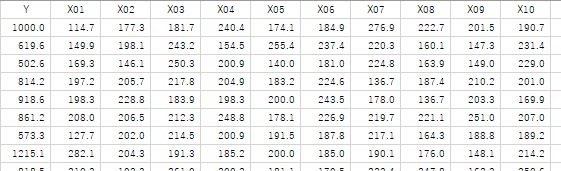
It is a comparison of methods. The data used here has 100 samples. There is a variable called Y and a variable from X01 to X10. Y is calculated from X squared and so on.
However, the Y in the sample in the first row is the number (1000) that you put appropriately without using a formula.
For general compression
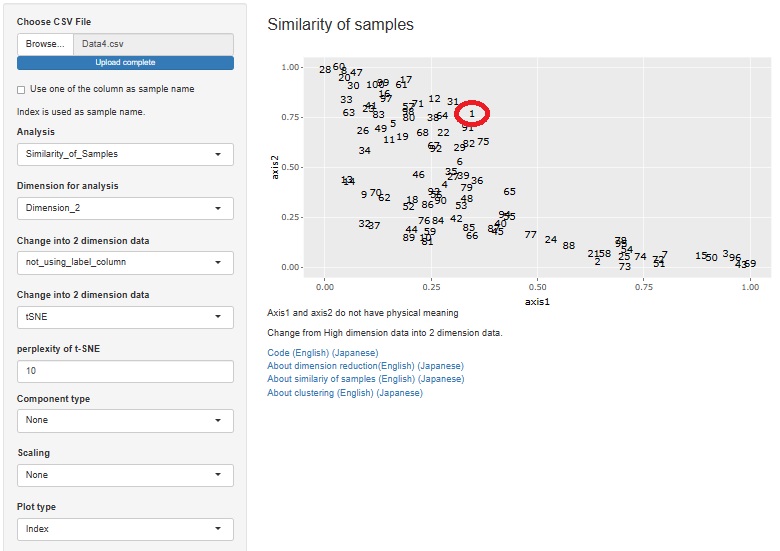
In the case of general compression, t-SNE is used on top. In addition to this example, I tried many other things, but the results were indescribable.
The sample in the first row is in the population.
For compression by regression analysis
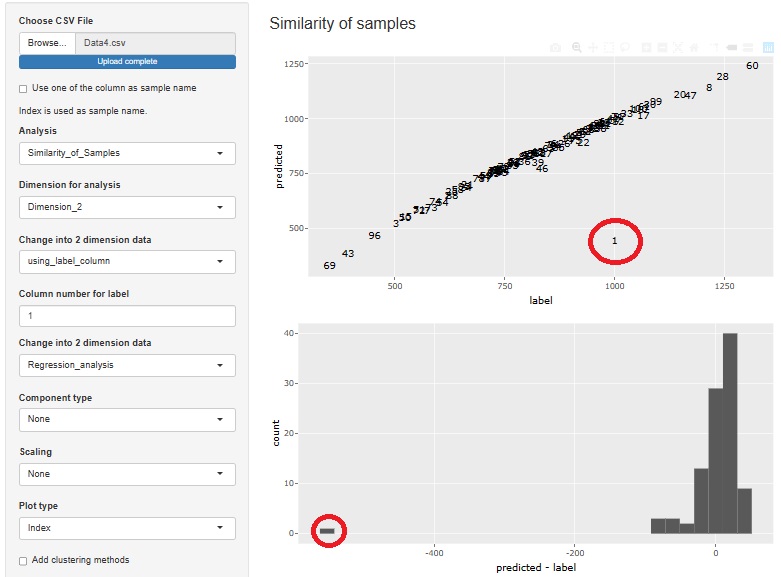
Compressed using multiple regression analysis.
The sample in the first row (the sample with the value 1000) is orphaned.
How to use compression with regression analysis systems
How to use compression with regression analysis systems
In addition to compressing high dimensions into two dimensions for visualization, sample similarity analysis is an analysis method in which there is no variable equivalent to Y.
"If there is a variable equivalent to Y" and "Analysis of sample similarity" are used in different places. For this page, it's together.
One of the uses of the regression compression method is to use it as an analysis of sample similarity for data with variables corresponding to Y.
It is also a way to find samples like outliers, as in the example above.
Software
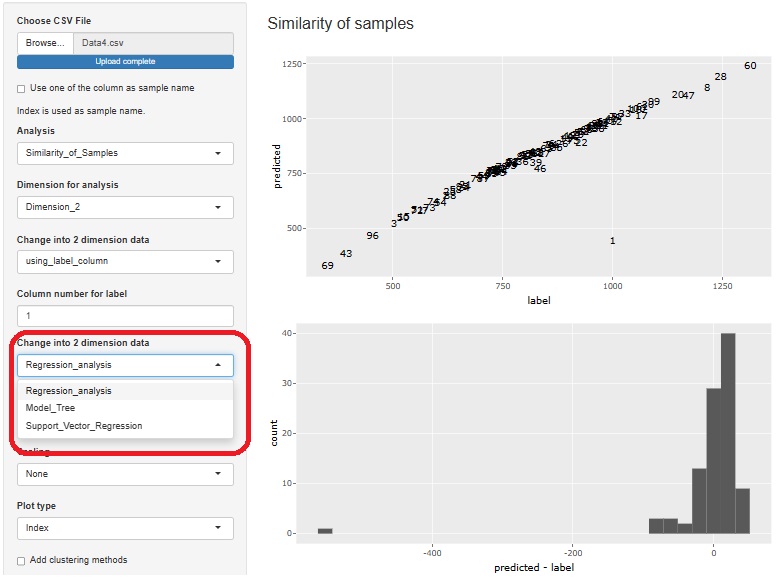
R-EDA1
If you want to use regression analysis as a regression analysis system, you can do it with R-EDA1. The figure above is an example of usage. In R-EDA1, a two-dimensional scatterplot is created with the original variable Y as "label" on the horizontal axis and Y' as "predicted" on the vertical axis.
Regression Analysis
,
Model tree
and
Support Vector Machine
can be used.
NEXT  Visualization by compressing high dimensions into two dimensions with Canonical Correlation Analysis
