By Independence Test and analyzing the relationship of variables, it is possible to Making Hypothesis by Correlation , but the asymmetry of the structure of the data is not known.
If you look at "conditional independence", you will be able to get the Structure of data that becomes a directed graph .
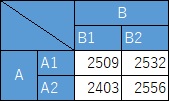
If the variables of the qualitative data A and B are independent, for example, the Contingency Table looks like this: There is not much bias in the frequency.
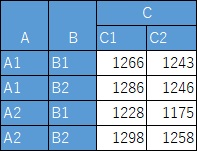
If the variables of the qualitative data A and B are independent, and A and B are conditional but independent, for example, the figure below. In this case, the frequency is not too biased.
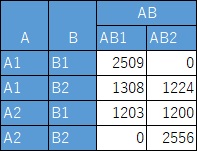
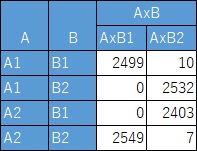
If the variables of the qualitative data A and B are independent and A and B are not conditionally independent, for example, the following two examples. In this case, the frequency is biased.
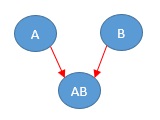
If conditionally not independent, the directed graph will look like the one below. Since the variables A and B are independent of each other, there is no line between A and B.
Structure Analysis by Bayesian Network is designed to comprehensively investigate conditional independence relationships and create directed graphs when there are many variables.
NEXT  Regression model data structure
