Independence Test is a method to judge the correlation between of items of row and and items of column.
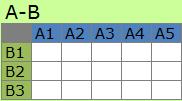
Contingency Table
If there is no correlation all values should be equal. Independence test use this idea.
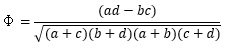
There are some indexes. Calculation is below.
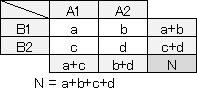

The following is an example of using the chi-square test of R for the test of independence . (The following is copy-paste and can be used as it is. In this example, it is assumed that the folder named "Rtest" on the C drive contains the data named "Data.csv".
setwd("C:/Rtest") #
Data <- read.table("Data.csv", header=F, sep=",") #
chisq.test(Data)
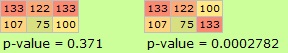
Try it with a 2*3 contingency table.
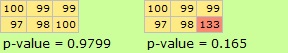
First, the six data in the table on the left do not vary much. In this case, the p-value is almost 1.
In the table on the right, only one piece of data is particularly large. In this case, the p-value is considerably smaller.
Try different types of 2*3 contingency tables.
The left and right tables only have the numbers in the rightmost column reversed, but the right table has a much smaller p-value. If there is any correlation between the row and column items, you will find that the p-value is small.
Try increasing the size of the table. The more you go to the table on the right, the greater the variability of the data.
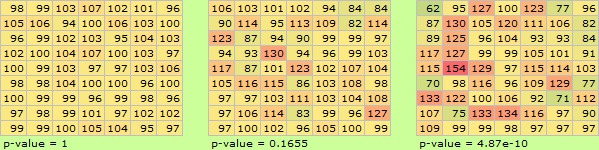
The greater the variability of the data, the smaller the p-value. It can be seen that the magnitude of the p-value varies depending on the variation.
If large variability is the point, it may be a good way to measure variability.
If you have only a few items in the row and column directions and the table size is small, you can use the independence test as a way to see the correlation, but if the table size is large , you can use this method for values. It's hard to find regularity.
The size of the table is 9*7, which is the same, but there are places where the value is extremely high.
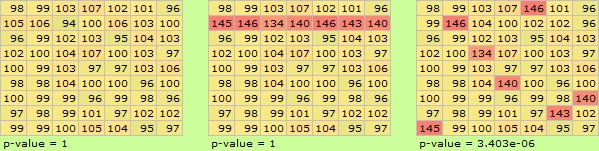
The table on the left does not vary much. In this case the p-value is exactly 1. In the center table, only one row has a higher value. Again, the p-value is exactly 1. The table on the right is a replacement of the numbers in the center table. The p-value is fairly close to 0.
In Part 1, I wrote "scale of variation", but if only a specific line has a high value and the variation is large, you can see that it cannot be measured with this scale.
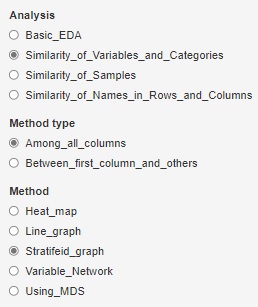
In R-EDA1, select "Stratifeid_graph" and then "bar" to test the independence using the variables selected to draw the graph. The procedure for creating a contingency table with two qualitative variables and performing a test is automatic.
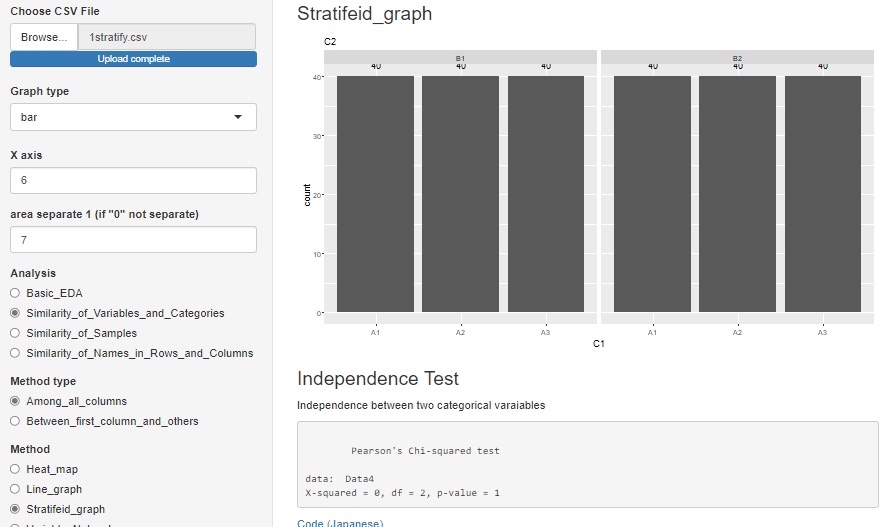
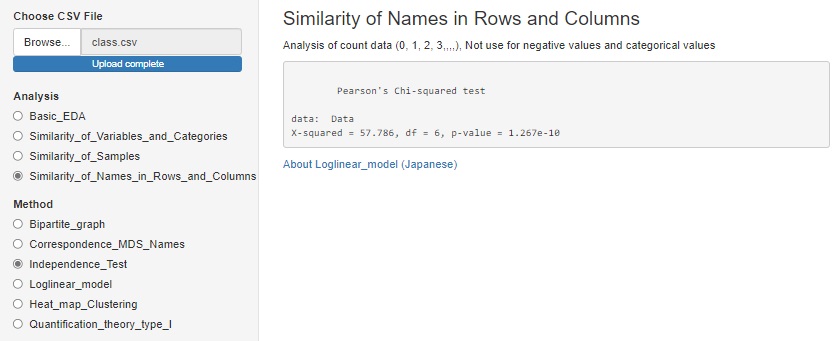
If you want to analyze the data that is already in the contingency table, it is in a different location than above.
NEXT  Log-linear analysis
