1
 ,
2
,
2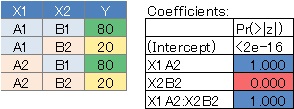 ,
3
,
3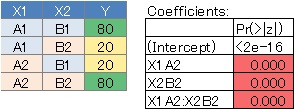 ,
4
,
4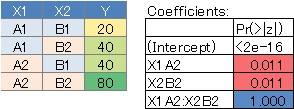 ,
,
Machine learning can be divided into two types: supervised learning and unsupervised learning when classifying methods .
Log-linear analysis is "unsupervised" with this division, but when it is executed, it includes a "supervised" method called a generalized linear model in the calculation. Due to these points, log-linear analysis is a special method, but because of this feature, it is possible to perform analysis that cannot be done by other methods.
If you know the analysis of experimental data , I find it easier to understand log-linear analysis as analysis of variance than as regression analysis . The difference from so-called ANOVA is that it uses logarithms and Poisson distributions to better fit the frequency (count values, count data).
Logistic regression analysis , use the log in the calculation regression analysis is. When I first heard about log-linear analysis, I thought from the name that it was " same or similar to logistic regression analysis ," but this understanding was wrong. Sure, I use logarithm and regression analysis, but the usage is different.
There are two uses for log-linear analysis below, but in terms of these two uses, log-linear analysis is a companion to the test of independence . The difference from the independence test is that you can analyze three or more variables smartly.
There are two main uses for log-linear analysis. It will be used as a method of modeling data in a contingency table and an analysis of variable grouping .
I think that the data in the contingency table is often analyzed by making it into a bar graph.
If there is a formula behind how the contingency table values ??are determined, log-linear analysis may be able to derive this formula.
The method of correlating multivariate data using the correlation coefficient is used for data of only quantitative variables, but log-linear analysis can be used as a method of using only qualitative variables.
When used as an analysis of variable grouping, the preprocessing is to aggregate the dataset in which the qualitative variables are lined up into the dataset of the contingency table .
Looking at the results of log-linear analysis, we can see whether the relationship between individual categories is significant, so I feel that it can be used as an analysis of grouping of individual categories .
However, some combinations of dummy variables are not used in the calculation to avoid multicollinearity , so using this result as a way to see the relationships between individual categories can be overlooked.
There may be a good way to use it as a way to see the relationships between individual categories, but I still don't know.
Contingency table is, cross-tabulation , I think that it is often made in the manner described. The rows and columns contain the names of the categories.
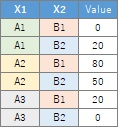
In cross tabulation , you can tabulate in various patterns depending on which variable is placed on the row side and the column side. Log-linear analysis uses a pattern aggregation where the frequency numbers are lined up vertically, as in the example below. That is, place all variables only on the row side.
Any form of data needs to be preprocessed and converted to this pattern.
I'm not sure about the academically accurate definition and formula of log-linear analysis, but as far as I can see on the net, it is a generalized linear model for a contingency table in which frequency numbers are arranged in a vertical column. It seems that it is common to introduce how to use. Therefore, this method is called log-linear analysis (Log linear model) in both this page and the software I made.
In the contingency table, the column with the frequency numbers is the objective variable, and the other columns are the explanatory variables. Explanatory variables are qualitative variables, but you can use a generalized linear model by performing dummy transformations and converting them to quantitative variables. Note that in the generalized linear model of R, if the explanatory variables include qualitative variables, the dummy transformation will be performed automatically.
We use a generalized linear model instead of the well-known multiple regression analysis because we assume a Poisson distribution for the error function and a logarithm for the link function.
In general multiple regression analysis , a linear model that uses the linear sum of each variable is often used, but in log-linear analysis, a quadratic model that includes the product term of each variable is used to see the interaction. Use the model. Consider the combination of variables whose interaction term is significant is the combination of variables with high correlation, and examine the combination of variables.
If the interaction term is not significant, then the effect of the variable combination is not related to the magnitude of the number. It means that the size of the numerical value is determined regardless of the effect of a single variable or the category of the variable.
Returning to the beginning, to use this method, I am using the "supervised" method even though it is "unsupervised".
In this example, it is assumed that the folder named "Rtest" on the C drive contains the data that is a contingency table with the name "Data.csv".
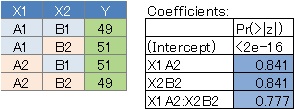
When there are two qualitative variables.
By arranging the four types of data and the results in the summary, it seems easy to understand what kind of analysis was done. First of all, if there is not much difference in the values, all variables have a large P-value.
No. 2 has a large P-value for X1 and a small P-value for X2 because the value is fixed regardless of X1. ..
No. 3 is the case where the interaction is strong, and the P value of the interaction term X1: X2 is small. This is the case when the two variables are strongly correlated .
No. 4 is the case where there is no interaction, the P value of X1 and X2 is small, and the P value of the interaction term is large.
1 ,
2
,
2 ,
3
,
3 ,
4
,
4 ,
,
This is the case when there are three qualitative variables.
Since we assumed a saturated model, all variable combinations were evaluated, but there are quite a few variables with large P values. In this case, it can be said that there is no highly correlated variable combination.
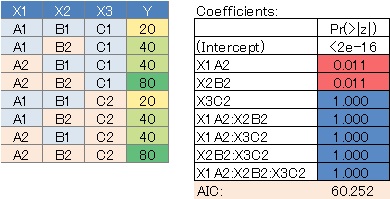
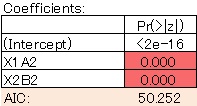
The model is clean. The AIC has also become smaller, so this is a better model.
loglm
Example of R is in the page, Log-Linear Analysis by R .
R-EDA1 can be used for both modeling of contingency table data in which item names are arranged in rows and columns, and analysis of variable grouping .
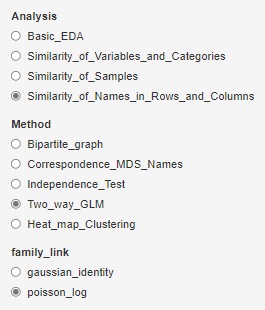
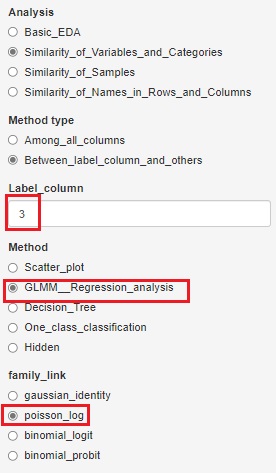
You can model the data in the contingency table by selecting "poisson_log" in "Two_way_GLM". By the way, if you select "gaussian_identity", it will be quantification type I by modeling when it is not frequency data.

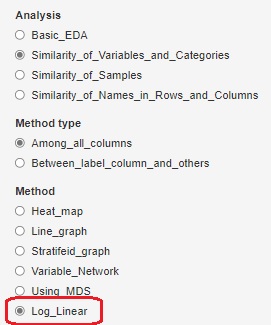
There are two ways to use qualitative variable data that is not aggregated in the contingency table. If you select "Log_Linear" in "Method", all variables in the dataset will be started and the model search will start. Select "Stratifeid_graph" and set "Graph type" to "bar" to start exploring the model, starting with the variable you selected to create the graph.
In the case of this function, if quantitative variables are mixed, the quantitative variables are treated as qualitative variables by one-dimensional clustering . Also, this example has 2 variables, but you can also have 3 or more variables.

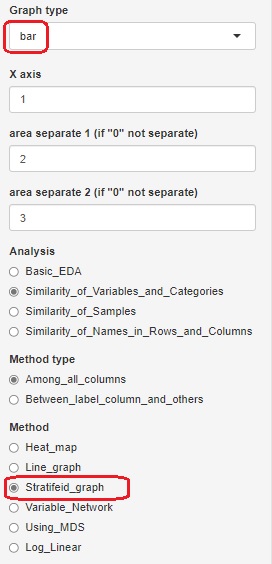
If you want to start with a contingency table with numbers in a vertical column, you can choose the Generalized Linear Mixed Models (GLMM) feature. In the case of the example, since the numerical value is entered in the third column, it is necessary to specify "3". With this type of contingency table, you can have 3 or more variables.
NEXT 

 Factor Analysis
