Log-Linear Analysis by R
This is an example of Log-linear analysis using R. The log-linear analysis here uses glm, a library of Generalized Linear Mixed Model , rather than having a library of log-linear analysis and using it.
Example of R
Saturated model of a two-way contingency table
In this example, it is assumed that the folder "Rtest" on the C drive contains the data that is a contingency table with the name "Data.csv".
When there are two qualitative variables.
library(MASS)
setwd("C:/Rtest")
Data <- read.csv("Data.csv", header=T)
gm <- glm(Y~X1*X2, data=Data,family=poisson)
summary(gm)
By arranging the four types of data and the results in the summary, it seems easy to understand what kind of analysis was done. First of all, if there is not much difference in the values, all variables have a large P value.
No. 2 has a large P value for X1 and a small P value for X2 because the value is fixed regardless of X1. ..
No. 3 is the case where the interaction is strong, and the P value of the interaction term X1: X2 is small. This is the case when the two variables are strongly correlated .
No. 4 is the case where there is no interaction, the P value of X1 and X2 is small, and the P value of the interaction term is large.
1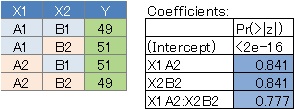 ,
2
,
2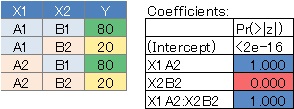 ,
3
,
3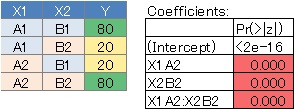 ,
4
,
4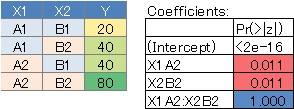 ,
,
Saturated model of ternary contingency table
This is the case when there are three qualitative variables.
library(MASS)
setwd("C:/Rtest")
Data <- read.csv("Data.csv", header=T)
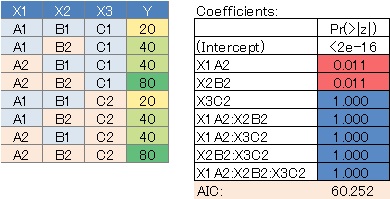
gm <- glm(Y~X1*X2*X3, data=Data,family=poisson)
summary(gm)
Since we assumed a saturated model, all variable combinations were evaluated, but there are quite a few variables with large P values. In this case, it can be said that there is no highly correlated variable combination.
Model with selected variables in the ternary contingency table
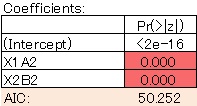
gm <- glm(Y~X1+X2, data=Data,family=poisson)
summary(gm)
The model is clean. The AIC has also become smaller, so this is a better model.
It is not limited to glm, but you can use "*" to create a model with interaction terms. For example, "X3 + X1 * X2", a model that contains a single term for each variable and an interaction term for X1 and X2.
Automatic selection of variables in a ternary contingency table
If you have 3 variables and each variable has about 2 categories, you can create a saturated model and then select the variables, but if it becomes more than that, it will be quite difficult. If you add "step", the selection from the saturated model will proceed automatically.
gm <- step(glm(Y~X1*X2*X3, data=Data,family=poisson))
summary(gm)
In this case, you will end up with the same result as the model for which you selected the variables above.
Attention of input data
The contingency table of the input data does not give the result that you think it does not contain all the combinations of categories. For combinations that do not apply, it is necessary to make a contingency table with a frequency of "0".
Also, in a general contingency table, variables are distributed to rows and columns, but when performing log-linear analysis using glm as described above, the contingency table has a format in which the frequency data is in one column. need to do it.
How to make a contingency table with R that can properly contain "0" and have frequency data in one column and use it for log-linear analysis can be found on the page of Analysis of variable similarity by R.
