A + B = AB
or
A * B = AB
is behind, this graph will be. Arrows are useful in expressing this expression.
The Calculation of Probability by Bayesian Network page starts with the case where the network of individual phenomena is known and the data of the probability of occurrence of individual relationships can be used to create a model of the Bayesian Network .
However, when you actually want to use a Bayesian network, there are times when you do not know the structure of the network or there is no data on the probability of occurrence.
Although there is no such prior information, when there is tabular data such as that used in multivariate analysis , the method of creating the probability of occurrence data from the tabular data and creating a model of the Bayesian network is described on this page.
On this site, Data Mining is divided into Analyzing variable companioning , Analysis of Similarity of Samples , and Analysis of individual category grouping .
Associations Analysis is a type of Analysis of individual category grouping . Models created as Bayesian networks look similar to association analysis because they have arrows, but the models show variables rather than individual categories. Bayesian networks are an analysis of variable grouping .
One way to analyze the similarity of variables by R is to use the number of associations of Kramer to examine the network structure of qualitative variables, but this is the closest method to Bayesian networks.
If you don't know the true causal relationship and want to find hints for considering the causal relationship from the automatically created model, rather than thinking that the causal relationship is represented by an arrow , use association analysis . It is harder to misuse it if you interpret it as "the structure of the data is represented by an arrow" like the graph created . It is one of the methods for searching hypotheses using statistical models .
In the structural analysis software, "this variable and this variable are not linked because they have no causal relationship" is blacklisted, and "this variable and this variable are linked because they have a causal relationship" are prepared as a whitelist. There is a function that the software estimates the part without information while referring to the information.
Some structural analysis software can use quantitative variables, but it is better to convert quantitative variables to qualitative variables before executing them.
Qualitative variables make the analysis less error-prone. An example of a mistake when it remains a quantitative variable is on the Differences of Bayesian network algorithm page.
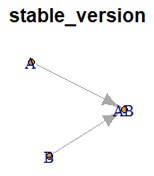
As a result of the analysis, the following graph is created. The meaning of this graph is that "AB can be created by using A and B". For example, if the formula
A + B = AB
or
A * B = AB
is behind, this graph will be. Arrows are useful in expressing this expression.
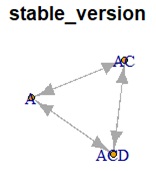
Or, suppose that the following graph is created as a result of analysis. The meaning of this graph is that "A and AC, AC and ACD, and A and ACD have similar structures".
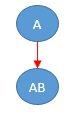
In the above example, if you look only at the arrows, you will see "AB is the result because of A and B". Since AB is made from A and B, if you think so, the arrow indicates the direction of the causal relationship.
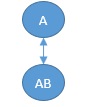
However, in the case of the phenomenon that "the value of AB determines the value of A or B", the direction of the arrow and the direction of the causal relationship are opposite.
Even if there is A + B = AB behind the data,
A + B =AB
f there is no variable for "B" and there are only "A" and "AB", the structural analysis by Bayesian network will not make the arrow unidirectional. Hmm.
Is the correct answer. Depending on the algorithm, the arrow may produce a one-way result, but in that case, if the variables are arranged in the opposite direction, the direction of the arrow will also be reversed.
By the way, although it is limited to quantitative variables,
LiNGAM
can lead to the result when only "A" and "AB" are used.
In the example below,
A and B are independent,
A and A2 and A3 are variables of the same value, and there is
a relationship of A + B = AB.
Is the result.
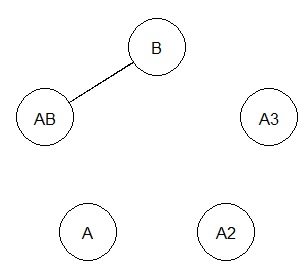
B and AB are tied, but A, A2, and A3 are not tied to AB.
If A2 and A3 are removed, the result will be below and you will see the background of the original data. It is often said that Selection of Variables is necessary , such as in
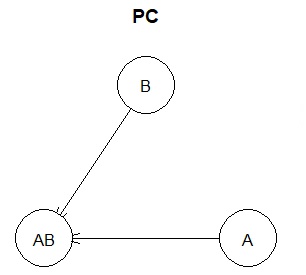
multiple regression analysis , but when examining the structure in a Bayesian network, if there is a group of variables that are exactly the same or highly correlated, before. As a process, it seems better to narrow down to one of the groups.
Suppose we have a variable called AC in addition to the above example. If we have a variable called C and it is made up of the formula AC = A + C, but C is not included in the data.
BN
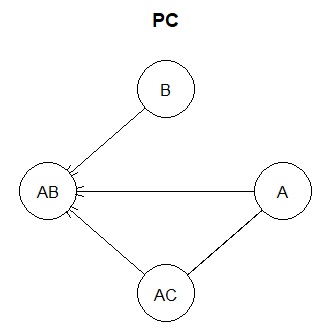
If you exclude B here, you can see that there is no arrow in one direction between A, AB, and AC.
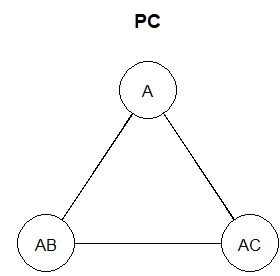
Also, the result will change when B and AC are excluded.
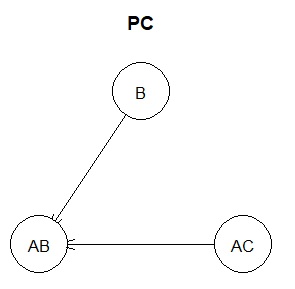
I made four types of graphs, but A and AC have the same relationship with AB and B. However, if A and AC are exactly the same, from the previous know-how, it should not be connected to AB, so you can see that A and AC have some similarities but are not the same.
In practice, when doing this kind of analysis, it seems best to consider and conclude the true causal relationship by comparing the results of the Bayesian network with what is actually happening. It's frustrating that we can't draw conclusions from the Bayesian network alone. Bayesian networks can be used as a hint for consideration.
Quantitative variables can be used in structural analysis software, but it is better to convert quantitative variables to qualitative variables before executing them. That is a less error-prone analysis. The reason is long, so it 's on the Differences of Bayesian network algorithm page.
As a result of the analysis, the following graph is created. The meaning of this graph is that "AB can be created by using A and B". For example, if the formula
A + B = AB
or
A * B = AB
is behind, this graph will be. Arrows are useful in expressing this expression.
Or, suppose that the following graph is created as a result of analysis. The meaning of this graph is that "A and AC, AC and ACD, and A and ACD have similar structures".
Even if there is A + B = AB behind the data,
if there is no "B" variable and only "A" and "AB", the correct answer for the Bayesian network structural analysis is
The arrow does not go in one direction.
By the way, although it is limited to quantitative variables, LiNGAM can lead to the result even if there are only "A" and "AB"
Weka and R are the free software. In Weka, HillClimber is one of the function to get Bayesuan network.
In R-EDA1, bnlearn library of R can be used in the GUI.
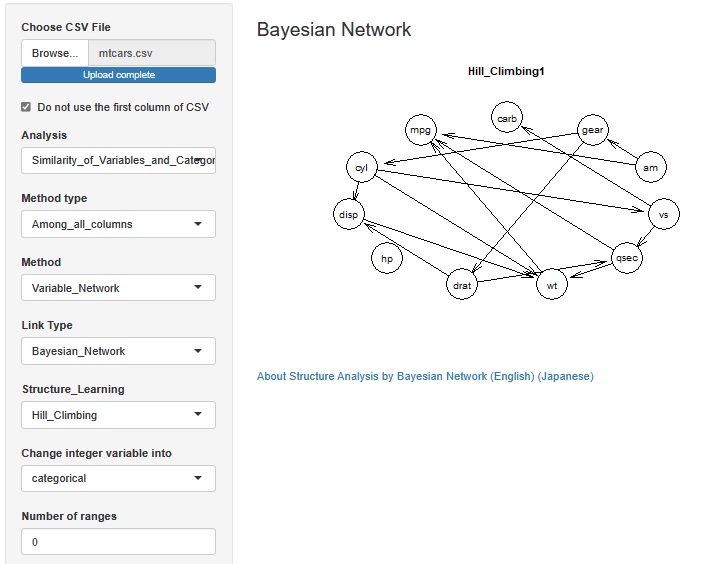
The above example is made with Hill_Climbing. If the algorithm changes, the direction of the arrow may be reversed.
When "Change integer variable into" is set to "numeric", variables that are "integer (positive integer)" are treated as quantitative variables. If set to "categorical", it will be treated as a qualitative variable. Even with numerical data, the contents of the numbers are not used. This function treats the number of the variable that is integer as the variable on the cause side when the size of the number represented by the number may not be particularly meaningful, or the variable that is integer is treated as the variable on the cause side. I attach it because there are times when it is better. In the Bayesian network, when there is a qualitative variable and a quantitative variable, an arrow is drawn from the qualitative variable to the quantitative variable side.
If "Number of ranges" is set to "5", for example, for each quantitative variable, the range between the maximum and minimum values ??is evenly divided into 5 ranges, and the name of each range is categorized. Is converted to a qualitative variable. If it is 1 or less, no conversion is performed.
NEXT  Differences of Bayesian network algorithm
