 Correspondence analysis
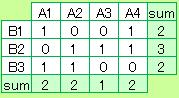
Q-analysis uses geometry (topology) mainly. Not Statistics .
Data for Q-analysis is 1-0 data. "1" means that "There is relation". Because of this kind of data, the analysis of the number of dimension and the analysis of shape below are able to be done.
ISM is a statistical approach for 1-0 data. And the study by Q-analysis is similar to correlation analysis .
Q-analysis is not used some special fields. But many analyses have been done in quantitative geography . And Q-analysis is used as a text mining method to study the relation of words.
The sum of "1" for each column and row is the dimension of each item.
Example of this page is that
(A1, A2, A3, A4) = (2, 2, 1, 2)
(B1, B2, B3) = (2, 3, 3)
.
If the number of dimension is close, the item set is close. Q-analysis classifies the items by the dimension.
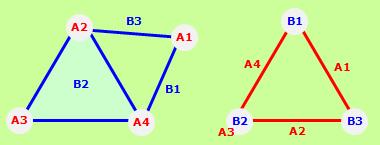
If "1" means the vertex of the shape, the data changes the shape.
This shape does not lose the information of the data. It is the difference from statistical approach.
This analysis is easy for low dimension analysis. It is difficult to sketch the shape for high dimension.
