Correspondence analysis is often described as a method of analyzing contingency tables .
By the way, quantification 3 class but it has been known to be one and mathematically the same, quantify 3 class is, it will not be described as a method of analysis of contingency tables.
Correspondence analysis is known as a method for handling qualitative data and count data, but if the input data is the same, the result is very similar to principal component analysis , which is known as a method for handling quantitative variables. Become.
Correspondence analysis and principal component analysis have almost the same effort when using R. The results are very similar.
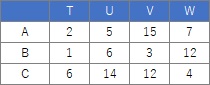
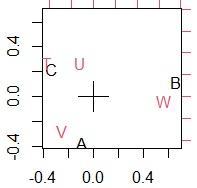
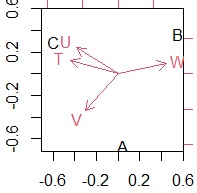
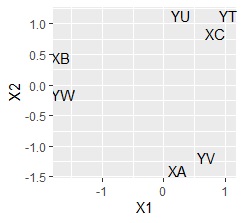
First, the result when the contingency table is the start of the data. Correspondence analysis is on the left, and principal component analysis is on the right.
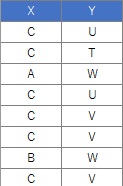
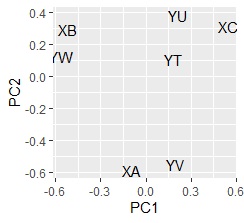
Next, it is the result when the original data of the above contingency table is started. Correspondence analysis is known as a contingency table analysis method, but even if the data obtained by dummy-converting the original data of the contingency table is used as input data, almost the same result will be obtained.
Correspondence analysis is on the left, and principal component analysis is on the right. The two methods are the same in that the orientation of the X-axis is opposite to that when the contingency table is used as input data.
Correspondence analysis and principal component analysis produce similar results, so there are times when it is okay to use them in the same way, but there are times when there are problems.
When using correspondence analysis instead of principal component analysis, correspondence analysis is based on the theory of treating qualitative data as frequency data, which causes problems when dealing with quantitative data. In principal component analysis, variables with completely different units such as temperature and pressure can be analyzed without problems, but when dealing with this in correspondence analysis, the process of directly adding values ??with different units is involved. It will be used unexpectedly.
So far, I don't know that "this is absolutely useless" when using principal component analysis instead of correspondence analysis. However, I wonder if it is a good idea to assume a multidimensional normal distribution for the count data, so if that point has a large effect, problems may occur.
Scatter plots are generally used as a method of analyzing the results of correspondence analysis, but it seems that only the first and second components are often seen. As a matter of fact, if you try to analyze the third and higher components, you will end up with two or more graphs, which makes the analysis difficult to use for decision making.
By the way, this problem is the same as principal component analysis .
Example of R is in the page, Correspondence analysis by R .
NEXT  Multidimensional simultaneous attachment diagram and bipartite graph
