Sample to make Type 2 data by Python.
At first, there is
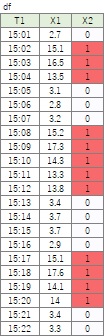
type 1 data
.
"X2 = 1" means moving.
"X2 = 0" means stoping.
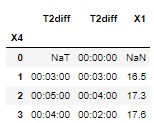
The left T2diff is the times by groups if X2 is 1.
The right T2diff is the times by groups if X2 is 0.
X1 is that max of X1 if X2 is 1.
This sample is not so difficult that "groupby" can be used.
"df2" is the data set of type 2 data.
import pandas as pd # import package
df= pd.read_csv("Data.csv" , engine='python')# read data
df['X3']=df.X2.diff() # make difference data of X2
df['X4'] = (df['X3'] == 1).cumsum() # if difference is 1, accumulate
df['X5']=df.groupby('X4').cumcount()+1 # make grouping variable
df['T2']=pd.to_datetime(df['T1']) # make time data
df['T2diff']=df.T2.diff() # make difference data of time
#from here, make type 2 data
df21=df[df.X2 == 1].groupby(['X4']).T2diff.sum() # calculate the time that X2 is 1
df20=df[df.X2 == 0].groupby(['X4']).T2diff.sum() # calculate the time that X2 is 0
df31=df[df.X2 == 1].groupby(['X4']).X1.max()# calculate the max of X1 if X2 is 1
df2 = pd.concat([df21, df20,df31], axis=1)# make data table
Make Data of Meta Knowledge
is used in this code.
The last table of "df" is below.
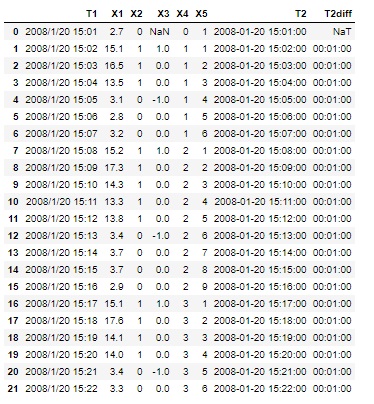
The last df can be used for Analysis of Type 1.5 .
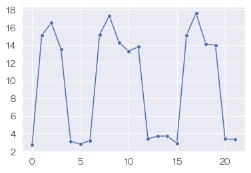
Graphs in this page is made with seaborn .
NEXT  Analysis of Type 3
