Survival analysis is a type of Time Analysis . When the handling time is "survival time (lifetime)", you can find out what you want to know from the survival time data.
The name is "survival time", but the method of survival time analysis is literally "survival time" analysis, "how the drug works", "time to event occurrence", "time to failure", "time to failure". It can also be used to analyze time such as "time to withdrawal".
Furthermore, as a method of dealing with physical quantities such as "length", it is a method that can be applied beyond time.
There are various explanations of survival analysis on the Internet, but there are unique difficulties such as the meaning of hazard functions. The data used as input is survival time, and the output is the difference in survival rate and survival rate, so it is easy to understand with a daily sense, but the calculation in the middle is in the world of mathematics, and it is everyday. It is difficult to understand by feeling.
In survival analysis, you can use the hazard function well to perform the analysis you want to do. Hazard functions are incomprehensible to me, at least for me.
On this page, I will explain the hazard function, but I tried to make it so that the input and output can be connected without using the hazard function.
In survival analysis, variability in survival time is the subject of analysis.
Survival time data is obtained as the difference between the time of measurement start and the time of measurement end. For example, "born / dead" is the start and end time. You can also start and end "enrollment / withdrawal", "start / effect", "start / failure", etc.
The start is recorded, but the end is recorded because of reasons such as "I didn't come to the hospital on the way, so I couldn't understand the progress", "I stopped the measurement because it was too long", and "The experiment period was over". No data may occur. Such data is called "censored data". Censored data is a type of missing value .
Even if there is a censoring, if the censoring time is recorded, the censoring data will be the data that "was alive until that time". In survival analysis, censored data is devised to be a method that can be used as data in such a position.
Suppose there are two people, A and B, A withdraws in two years and B withdraws in three years.
Using this data, we can calculate that the survival rate in the first year is 1.0, the survival rate in the second year is 0.5, and the survival rate in the third year and above is 0.0.
Survival rate is called the survival function. S (t) .
In the above example,
S (1) = 1.0
S (2) = 0.5
S (3) = 0.0
S (4) = 0.0
The instantaneous mortality rate at a given moment is called the "hazard function".
h(t)
The integral of the hazard function h (t) from time 0 to a certain time is called the cumulative hazard function.
H(t)
I wrote the hazard function as "instantaneous mortality" above, but the cumulative hazard function is not mortality.
The cumulative hazard function and the survival function (survival rate) have a relationship of
H(t) = -log(S(t))
and
S(t) = exp(-H(t))
One "average survival time" can be obtained for the data you have.
On the other hand, the survival rate has the property of gradually changing, so it is not something that one can be found for the data that you have. As with A and B above, it is easy to calculate the change in survival rate if there are only two people, but it becomes difficult if the number of people increases or if censored data is included.
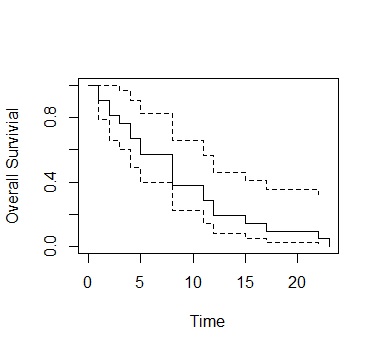
The Kaplan-Meier method is a method similar to the calculation in the examples A and B above.
It is soft and easy to calculate. From left to right is the flow of time, and the graph shows how the survival rate gradually declines.
The parametric model assumes a mathematical formula for the survival function.
For example, assuming
S(t) = exp(-At)
,
S(0) = 1
S(inf.) ~ 0
and it is possible to express how the survival rate decreases exponentially. The magnitude of A can be used to adjust how it fits into the actual data.
The exponential distribution is assumed when the hazard function (H (t)) is constant (A), that is, when the instantaneous mortality rate does not change.
Assuming the Weibull distribution, the instantaneous mortality rate (failure rate) is gradually decreasing, as in the initial failure of industrial products, and the instantaneous mortality rate is gradually increasing, as in the case of failure when it is used up. You will be able to express various phenomena. Weibull distribution is used in the field of Reliability Engineering to analyze the life of industrial products .
By the way, the Weibull distribution is also the distribution of Extreme Value Statistics .
In the field of medicine, it is important as a research theme to investigate "Is there a difference in survival rate depending on the drug?"
For example, when there are two types of changes as shown below, it is an analysis of whether to consider them the same or different.
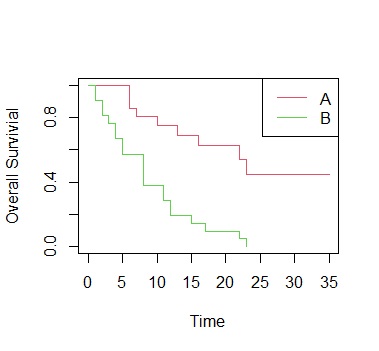
Survival rate has the property of changing gradually, so it is not possible to simply compare the two values. Therefore, a method for analyzing the difference in survival rate has been devised.
The Logrank test and the generalized Wilcoxon test are advanced versions of the method of collecting data in a Contingency Table and performing an Independence Test .
Create a contingency table for each time point and calculate the statistics. In that respect, the Logrank test and the generalized Wilcoxon test are the same.
The generalized Wilcoxon test is a calculation method that does not emphasize the difference in survival rate because it can take into consideration that the more reliable data decreases as the time progresses.
Cox regression analysis is also known as the "proportional hazard model". This method assumes that the ratio of hazard functions is constant.
Cox proportional analysis is classified as a "semiparametric model" because the hazard function is the product of the nonparametric and parametric parts. The part that changes with time is nonparametric. The part that affects the difference in survival rate is parametric.
For example, the part that affects the difference in survival rate is expressed as
exp(a * x)
For example, use either 0 or 1 for x with or without drug A.
Furthermore, the part that affects the difference in survival rate can be expressed as
exp(a1 * x1 + a2 * x2 + ...)
By doing this, you will be able to handle even if there are two or more factors that cause a difference in survival rate.
Cox regression analysis differs from the Logrank test and the generalized Wilcoxon test in that it can handle two or more factors. This is the good thing about Cox regression analysis.
The generalized Wilcoxon test can take into account the loss of reliable data over time. This is the good point of the generalized Wilcoxon test.
Examples by R is in the page, Survival Analysis by R .
NEXT  Passing Analysis
