The simplest form of the mathematical model of Proportional variance is the equation :
Y = E * X
The next simplest form is
the following equation:
Y = (a + E) * X
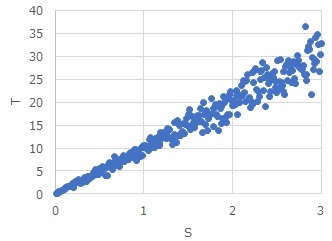
The meaning of this formula is "The product of the cause X and the error is Y". In the world, if you use a scatter plot of Y and X with a high correlation, the larger the X, the greater the variation in the Y direction.
Once you know this structure, it will be one of the Structure of data that becomes a directed graph.
The following story about using skewness and kurtosis to identify the structure of the Proportional variance model is the author's idea. There may be previous research in the world. If you know of such literature, I would appreciate it if you could tell me.
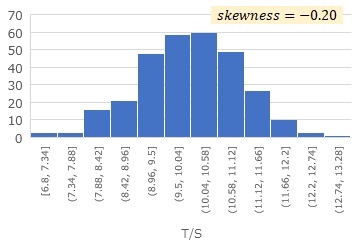
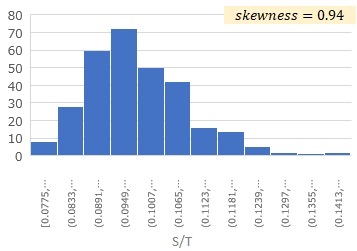
If E is normally or uniformly distributed, E is symmetrical. 1/E is asymmetrical. The more asymmetric it is, the greater the absolute skewness. Take advantage of this property.
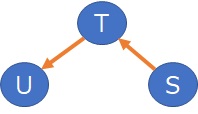
Specifically, when there are two variables, S and T, S / T and T are calculated, and skewness is calculated for each. For example, if the skewness of T/S is -0.20 and the skewness of S/T is 0.94,
you can estimate
T = (a + E) * S
The structure is represented by arrows as shown below.

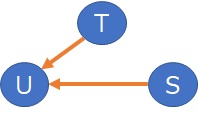
Suppose there are three variables with the relationship
T = (a1 + E1) * S
U = (a2 + E2) * T
Two steps are required to identify the structure between the three variables.
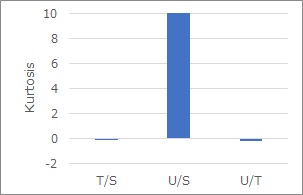
Using the method for 2 variables, calculating the skewness will look like the graph below.
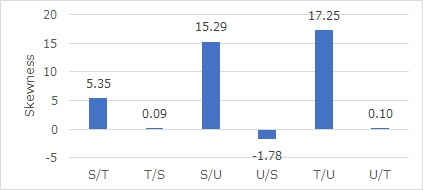
For S and T, S and U, and T and U, you can see the direction of the arrows in each, and if you express them as they are with arrows, they will be down. Judging by the skewness alone, this is what happens.
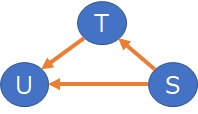
Here, too, between S and U, there is an arrow.
First, make sure it's happening between S and U.
U = (a2 + E2) * (a1 + E1) * S
The relationship between you and S is as shown above.
The part
(a2 + E2) * (a1 + E1)
multiplied by S is the product of normal distributions, but this is a symmetric distribution to determine the direction of the arrows between S and U.
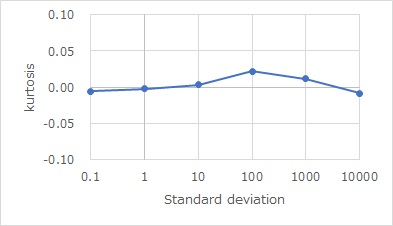
This is where kurtosis is used. The graph below shows the kurtosis of the normal distribution. We calculate using 10,0 samples. Regardless of the magnitude of the standard deviation, we can see that it is almost 0.
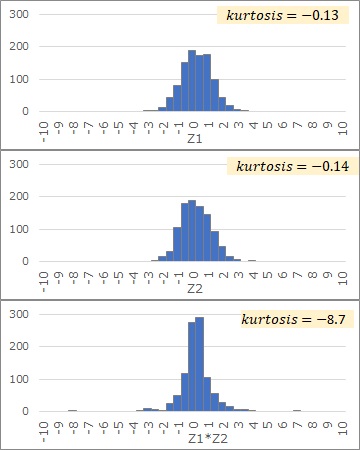
Also, it is the product of normal distributions, As shown below, if there are two normal distributions, Z1 and Z2, the graph of the variable Z1*Z2 is more pointed than Z1 and Z2. You can see the difference in this sharpness by the kurtosis.
Use the kurtosis properties described above. The kurtosis is calculated as shown in the graph below. From this graph, we can see that you and S seem to contain the product relationship between normal distributions, and the arrows between you and S can be removed.
There is an assumption that E is symmetrical. Even if the larger X is, the greater the variation in the Y direction, this is not possible if E is not symmetrical.
Therefore, it is better to make a histogram for both E and 1/E to check it.
The structure of the data that becomes a regression model, that is, if Y = X + E, it cannot be determined by skewness because Y/X is asymmetric.
In real data, the structure of the data that results in the regression model and the data structure of the Proportional variance model can be difficult to distinguish.
In the case of 3 variables, the above method can be examined at such times.
If two variables affect one variable, that is, when it is as shown below, it cannot be examined.
NEXT  Time Difference of Cause-Effect
