Standardization and Normalization and Principal Component Analysis are used as data preprocessing. With the methods, the original data and the range of values are changed.
Depending on the data, standardization or normalization after creating the principal component may make the characteristics of the data easier to understand. The following are examples of when used alone and when used in combination. Example 1 is an example in which the effect is sufficient even when used alone, and the effect of the combination is not effective. Example 2 is an example in which the effect of combination is large and it is difficult to analyze afterwards without combination.
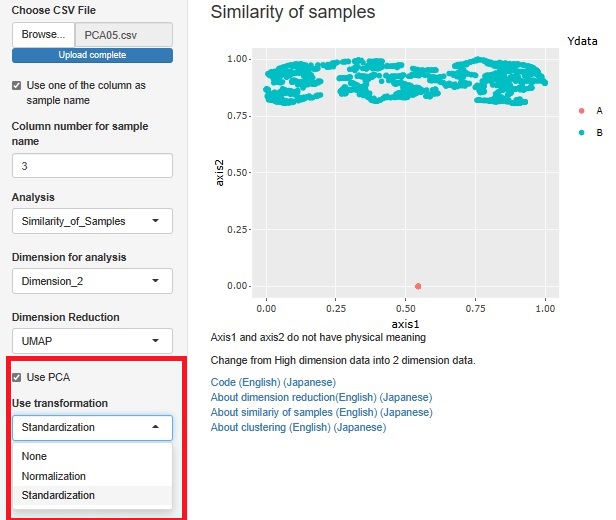
Below, we will see what happens if the preprocessing is different when UMAP of Visualization by compressing high dimensions into two dimensions .
Principal component analysis uses the one that uses the correlation matrix.
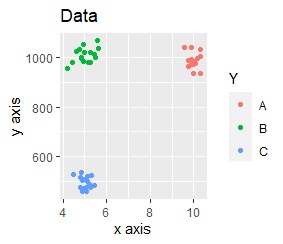
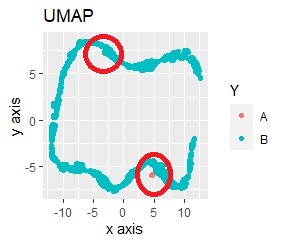
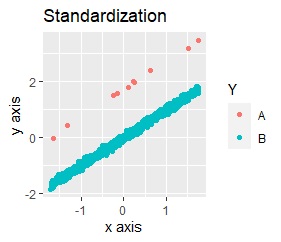
The range of values ??on the two axes is an order of magnitude.
The effect of the order of magnitude is large, and the group is divided into two, making it impossible to distinguish between A and B.
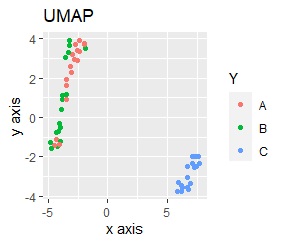
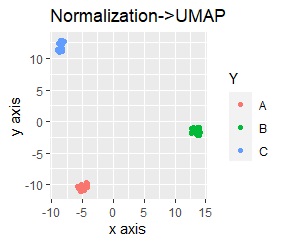
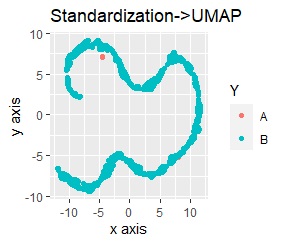
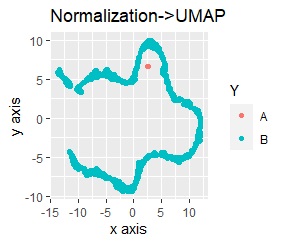
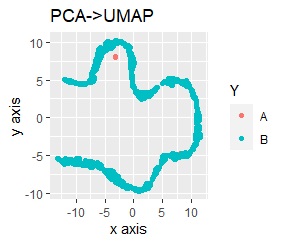
From the left, only Standardization, only Normalization, and only Principal Component Analysis (PCA).
In each case, the three groups separated cleanly.
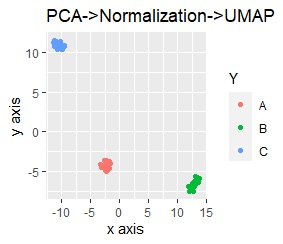
On the left is the principal component analysis (PCA) followed by normalization.
It is not particularly different because it is effective enough by itself.
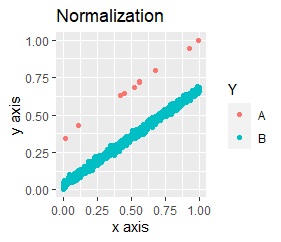
The data to be analyzed. B is the majority of the distribution, and A is like an outlier.
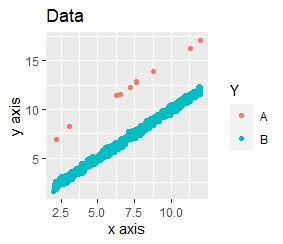
You can see where A was placed because it is colored, but without the color, the characteristics of the original data are not visible.
From the left, only Standardization, only Normalization, and only Principal Component Analysis (PCA).
In both cases, the outlier A is a lump and is a little far from B.
Only pre-processing is below.
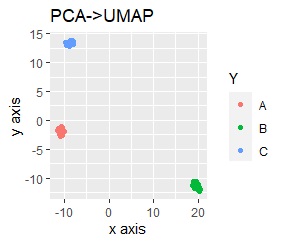
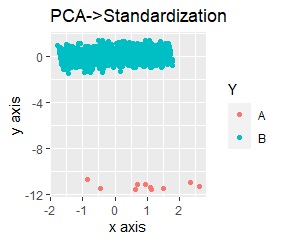
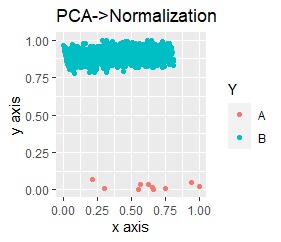
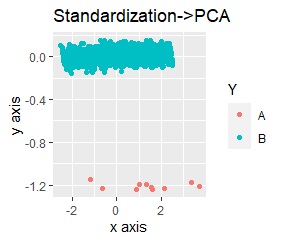
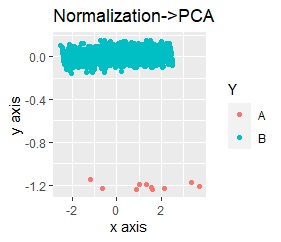
The left is Principal Component Analysis (PCA) followed by Standardization, and the right is Principal Component Analysis (PCA) followed by Normalization.
The mass of A is completely away from B.
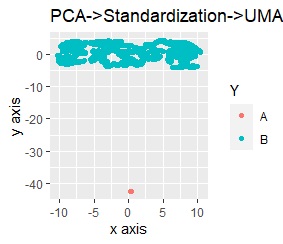
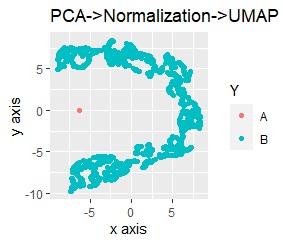
The range of y-axis in normalization is larger than standardization.
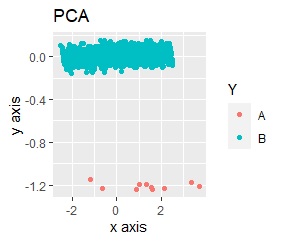
Only pre-processing is below. Visually, these graphs are same to the PCA-only. But the range of axis is different.
"Range of Y-axis / range of X-axis" of PCA-only is "1.4 / 7 = 0.2". PCA-Standardization is "14 / 5 = 2.8". PCA-Normalization is "1 / 1 = 1".
Tha order of ratio is similar to the order of clearity of graphs.
The reason why the ration of PCA-Normalization is larger is that sample number of A is far less than B.
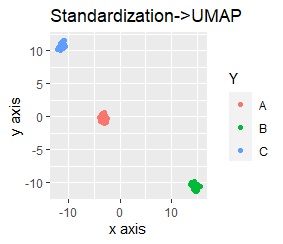
The left is Standardization followed by Principal Component Analysis (PCA), and the right is Normalization followed by Principal Component Analysis (PCA).
The results are the same as when standardization, normalization, and principal component analysis were performed independently. When combining, you can see that the order is important.
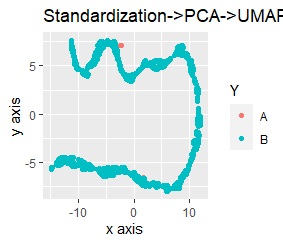
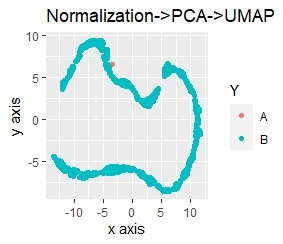
Only pre-processing is below. These are same to the PCA only.
In R-EDA1 , when using Visualization by compressing high dimensions into two dimensions , the above methods can be used alone or in combination. When combined, principal component analysis is processed first.
NEXT  Analysis Using Intermediate Layer
