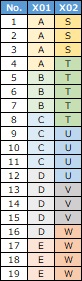
Suppose you have qualitative variable data as shown above.
This page is a type of Scaling Method. It is similar to Converting a group of binary variables into a single continuous variable.
Suppose you have qualitative variable data as shown above.
Correlation of qualitative data If you look at it, the data shows that "X01 and X02 are highly correlated".
There are categories A, B, C, D, E and S, T, U, V, and W, and you can see that "A and S are often together" or "B and T are often together". I don't know more than that.
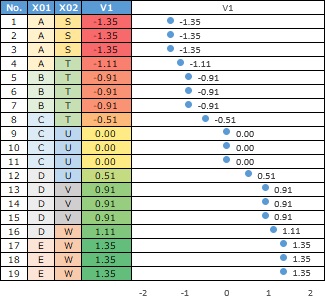
Suddenly, if you do a Correspondence analysis on this data, you can also find the following two things.
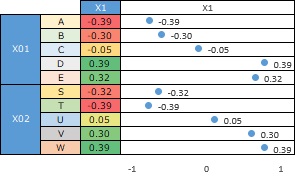
The first is the numerical data for each sample. It is not a 1-0 discrete value like a dummy transformation, but a number with a small decimal point. On this page, these numeric variables are called "continuous variables".
The second is the numerical value for each category. In this example, the alphabetical order and the order of the numbers are the same, but it just so happens. For example, if S and T are swapped in the above data, the smallest number will be T.
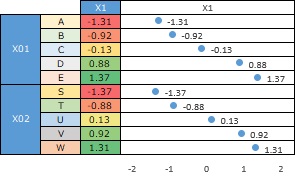
In this way, qualitative variables can be treated as quantitative variables.
In a typical use of correspondence analysis, data such as "only A and S are often together" is fine. To use the methods on this page, the other categories must be similar and highly correlated with qualitative variables.
Also, even if the correlation is high, it cannot be used if the categories of the two variables exactly coincide, as in the data below.
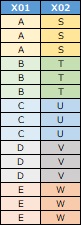
Also, the categories must have an order. Such data may have such a thing as a latent variable, where two qualitative variables have the same latent variable behind them.
When correspondence analysis is performed, not only variables such as V1 mentioned above, but also variables such as V2 and V3 are output.
In general, for example, you can create a two-dimensional scatterplot of V1 and V2 and analyze the similarity of each sample.
However, the method on this page only picks up V1. It is a type of feature engineering to use this as a quantitative measure.
Similar to the method of converting a group of binary variables to one continuous variable, when only one way (one variable) evaluation can only be done roughly. It is a method of preparing multiple variables to obtain highly accurate numerical data.
In the above, it is 2 variables, but you can also use 3 or more variables.
Item reaction theory has a stepwise reaction model when there is an order as a method in which the qualitative variable has three or more values. The method on this page is similar to the method of obtaining output.
The stepwise response model software processes it as ordinal data in a dictionary order of categories. The method on this page does not use information in the dictionary order of categories. The order information is intended to be read from the data.
In fuzzy theory, the relationship between categories and numbers must be determined by people. With the method on this page, numerical values are obtained by calculation from the data.
On this page, the first variable created during correspondence analysis is interpreted and used as a latent variable behind the qualitative variable. Reads ordinal information from the data.
I don't know why this is possible. However, no matter how many things I tried, it always happened, and since Quantification III was originally developed as a way to quantify such properties of data, it seems that I did not do anything wrong.
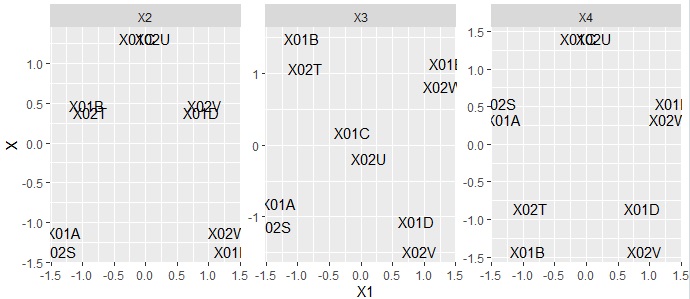
By the way, if you make a scatter plot with the first variable as the horizontal axis and the second to fourth variables as the vertical axis, it will look like the following. The first variable is a variable that will be in the expected order, but the other variables are different. However, if you look at the arrangement of the variables, you can see that there is symmetry, so the process is like decomposing modes.
On the Correspondence Analysis page, I wrote that an analysis similar to correspondence analysis can be done with Principal Component Analysis, and that Principal Component Analysis is more versatile.
If you perform the same analysis as above in Principal Component Analysis, you will see the figure below.
It is roughly correct, but the order has not been reproduced accurately. For this reason, the method on this page seems to be a better method for correspondence analysis.
NEXT  Standardization and Normalization
