Convert a group of binary variables into a continuous variable
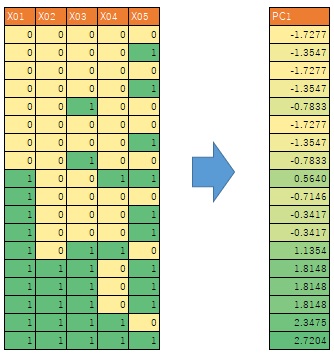
The data on the left above has only two values: 0 and 1. On this page, we will refer to these variables as "binary variables". Then, when it contains various numbers, including decimal points and negative values, such as the data on the right, it is called a "continuous variable".
As described on the Transformation Quantity and Quality page, binary variables can represent qualitative data. We use 0 and 1 to express the "without" of something qualitative.
The method of transforming a group of binary variables to obtain a continuous variable is a type of Scaling Method. The data on the right side of the figure above is the data on the left using the scaling method. It is a method for advancing quantitative analysis in the field of psychology, where only qualitative data can be obtained.
It is not possible to obtain multiple binary variables, but if there are multiple variables and they are affected by something in common, you can get that something as a continuous variable. In the context of psychology, "something" is a psychological nature. In the case of test data, it is a measure that is difficult to measure directly, such as "English proficiency".
Scaling is a method for analyzing things that can only be measured with qualitative or binary variables as if they were measured with continuous variables. For continuous variables such as temperature, you only need to measure one variable, but in the scaling method, the point is that you measure them as multiple binary variables and lead to the acquisition of continuous variables.
Item Reaction Theory and Principal Component Analysis
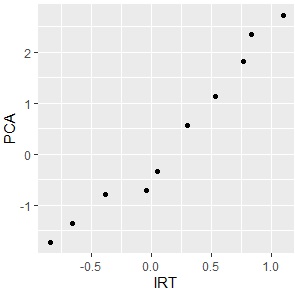
Item Response Theory (IRT) and Principal Component Analysis (PCA) can both be used to transform a group of binary variables into a single continuous variable.
The figure below compares the data in the table above with the two methods. Since they are almost aligned, you can see that there is little difference between the two methods.
In this example, the first factor is compared. Even with data that also has a second factor, these methods can be accommodated.
In the commentary of the world, I sometimes see it written that "the results of factor analysis and principal component analysis are similar", and the same thing is happening.
When there is a difference between item reaction theory and principal component analysis
Item reaction theory has a stepwise response model, which can also handle ordinal scales.
In a graduated response model, the ordinal scale is treated as an ordinal scale. In principal component analysis, when dealing with ordinal variables, you will either use a dummy transformation to lose ordinal information or treat the ordinal scale as if it were a continuous scale, so the results do not seem to be similar.
Multidimensional scaling
The Scaling Method page describes multidimensional scaling methods in broad and narrow terms.
Multidimensional scaling in the narrow sense is the content on the Networked multidimensional scaling page. It is basically a method of converting distance data to coordinate data (continuous data). For example, you can calculate coordinate data for making a map from the data between cities.
Therefore, if the original data is converted to distance data, the narrow multidimensional scaling method can also be used as a scaling method for 1-0 format data as described above.
Precautions when using the narrow multidimensional scaling method
If there are samples of exactly the same data, the distance between them will be 0. Narrow multidimensional scaling software may fail to proceed with an error if there is a sample with a distance of 0. Unlike continuous data, data in 1-0 format tends to contain multiple samples that are exactly the same, which is inconvenient in practice.
By the way, not only multidimensional scaling methods in the narrow sense, but also other methods in a href="ede1-3-3-1.html">Visualization by compressing high dimensions into two dimensions may cause similar errors. R multidimensional scaling and t-SNE gave an error and could not do it.
Therefore, in addition to the comparison between item reaction theory and principal component analysis above, I tried to add a comparison with the multidimensional scaling method in a narrow sense. I gave up because I got an error.
Comparison of methods
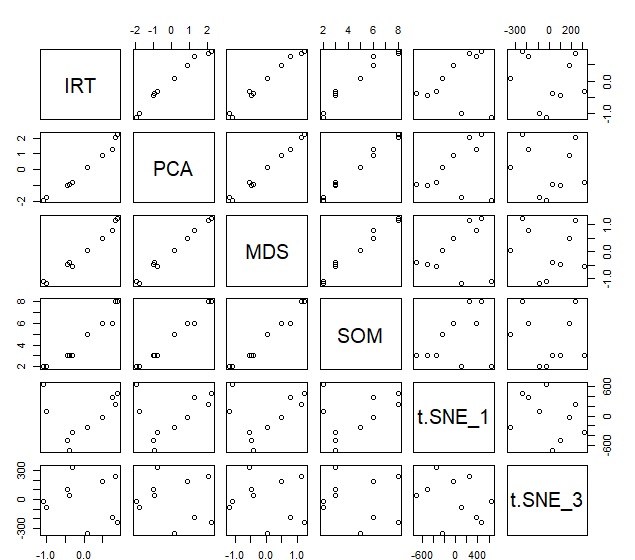
We created a dataset with no duplication from the above dataset and compared various methods. It is often a method of dimensionally reducing to two dimensions, but here it is compressed to one dimension.
-
IRT : Item Reaction Theory
-
PCA : Principal Component Analysis
-
MDS : sammon in the narrow sense of multi dimensional scaling
-
SOM : Self Organizing Map. There are 10 lattices, only one vertical row
-
t-SNE : t-SNE. Subscripts 1 and 3 are perplexity. Set to dims=1
IRT, PCA, MDS, and SOM have almost the same results and are highly correlated. t-SNE was not correlated at all. This seems to be because t-SNE is a way to look only at the proximity of each sample, rather than the trend of numbers.
How to make two or more continuous variables
Above, we talked about converting a group of binary variables into a single continuous variable. If this is the only purpose, you can create one continuous variable even if you calculate the sum value or average value for each sample for the value of the binary variable. You don't have to use item reaction theory.
If you use only one continuous variable and you want to use item response theory, you may also want to design and analyze test problems.
Comparing methods is done when one continuous variable is sufficient, but the sum or average value for each sample does not help, and the scaling method is really effective in. If it is not two or more continuous variables, it will not come together well.
NEXT  Converting a group of qualitative variables into one continuous variable
