Item response theory(IRT) is often introduced as a theory for quantitatively measuring human ability in qualification tests.
However, there are many possible uses other than the theory of testing.
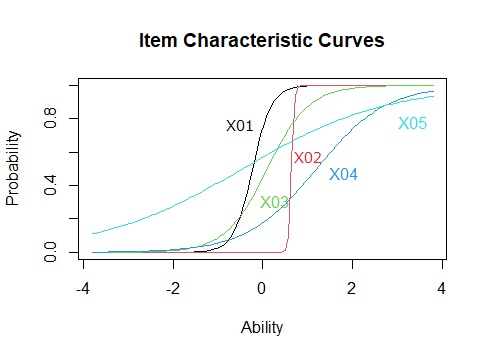
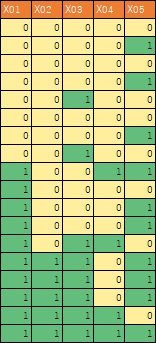
In IRT, you can make a graph like the one below. The table is the data when making this graph.
In the graph, the data that had only 0 and 1 is made into numerical data from 0 to 1.
In this example, 0s go to the top of the table and 1s go to the bottom of the table, so the arrangement of 0s and 1s roughly matches the curve of the graph.
This example is used to make it easier to understand the relationship between inputs and outputs, but in item response theory, the outputs are the same even if the order of the data in the table is different. To make this possible, item response theory creates a new variable for use on the horizontal axis.
By the way, if you want to match the order of data with the curve of the graph, there is a method of performing Logistic Regression Analysis for each variable with "order of data" as the explanatory variable.
Forget about its use as a test theory, and rethink the question, "What is item response theory?"
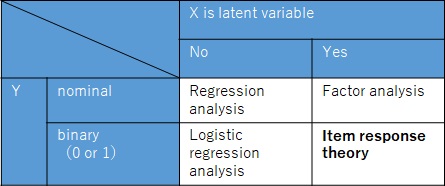
With that in mind, first, item response theory is a method for comparing the characteristics and similarity of each variable for data that has multiple variables of binary data of 0 and 1. Also, in the case of such data, it is a method to evaluate the position of each sample with a small number of variables.
Item response theory is commonly described alone as a methodology for designing tests. However, if you compare the contents with the method of Multi-Variable Analysis, it is the same as Factor Analysis in that it uses latent variables, and it is the same as Logistic Regression Analysis in that it uses logit . ( There is also an item response theory that uses probit .)
The qualification test is held once a year, for example.
If you are taking a 100-point test and A scored 70 points in this year's test and 75 points in last year's test, the problem you are solving is different, so "A's ability has declined." I can't say.
Also, even if the ranking changes from 25th to 30th, it cannot be said that "A's ability has declined" because the total number of people and the examinees are different.
The deviation value is a commonly used method for measuring A's ability. In the standard normal distribution, the mean is 0 and the standard deviation is 1, but the deviation value is converted from the original distribution so that the mean is 50 and the standard deviation is 10.
Deviation values ??allow different sample sizes, means, and variability in the original distribution to be evaluated on the same scale.
However, even if your deviation value does not change, your overall ability may have decreased, and your ability may have decreased. Also, when the average value is different between the two exams, there are two possible causes: the difficulty of the question is different and the overall level of the examinee is different, but I do not know which one is affecting how much.
In addition, as a method that is not item response theory, there is a method of judging the difficulty of a question based on the correct answer rate of each question.
However, for example, if the correct answer rate is 50%, it is unknown whether 50% of the people have the ability to solve the problem correctly, or if the problem is solved without thinking, there is a 50% chance that the answer will be correct. am.
Item response theory allows you to assess the quality of a problem.
For example, suppose the item in the graph at the beginning is an exam question.
In this way, you will be able to evaluate the relationship between the problem and the ability you want to measure.
In addition, each candidate will be able to evaluate their ability based on where they are on the horizontal axis of this graph.
Using item response theory, for example, you can create a test in which 1000 questions are prepared and 100 of them are randomly selected and solved for each examinee.
You can assess a candidate's ability, even if the question is different for each candidate.
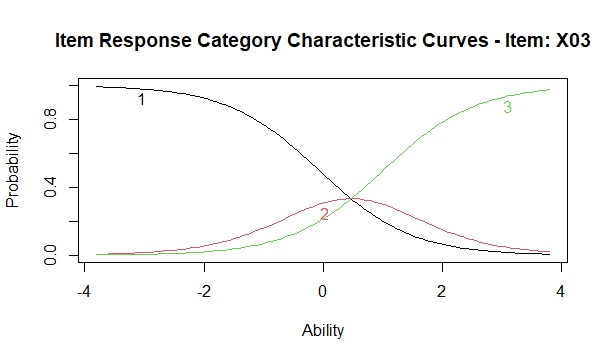
Graded Response Model(GRM) is the method for ordinal scale variable.
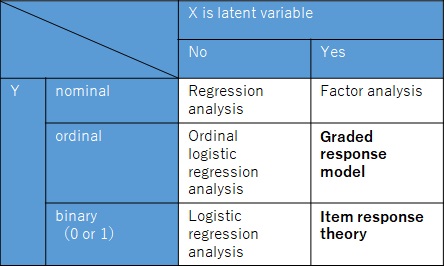
Within a single variable, the distribution of each category is determined using the property that the sum of the probability is 1.
There is a page of Item Response Theory by R.
NEXT  Data Mining
