The range of probibability data is from 0 to 1.
Logit transformation is known as a better method to deal with probability data in Multi-Variable Analysis than to use raw data.
Logit = log( p / (1 - p))
p is the probabitity.
The bottom of log is the number of Napier (=2.71,,,)
This transformation of p is called "Logit Transformation".
By the function of Excel
=Ln(p/(1-p)).
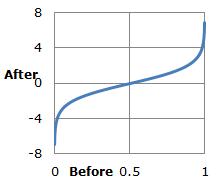
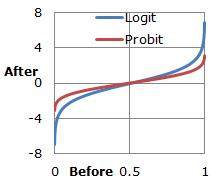
The scatter plot of p and logit shows a curve.
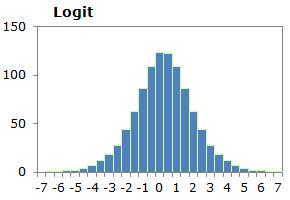
Histgram of logit is similar to normal distribution.
Famous method of Multi-Variable Analysis is Logistic Regression Analysis.
Probit is the nunber that deal with probability as the part of standard normal distribution.
By the function of Excel
=norminv(p,0,1.
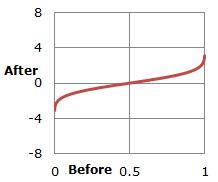
The scatter plot of p and probit shows a curve.
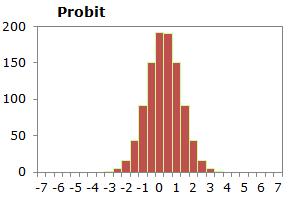
Histgram of probit shows standard normal distribution.
Probit analysis is similar to Logistic Regression Analysis.
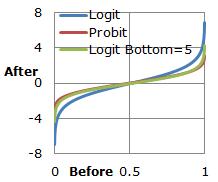
Logit and Probit is similar.
Logit is wide.
If we use 5 as the bottom of log of logit, the trasnformation is more similar to probit.
By the function of Excel
=log(p/(1-p),5)
NEXT  Odds Ratio
