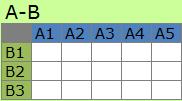
The factors of A and the factors of B have one to one relationship in
A-B Type.
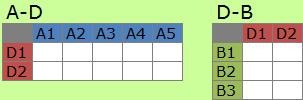
As analysis of the stracture of the matrix, decomposition is used.
New view ("D" in the example) appears. In many cases, the number of the factors of D is less than that of A and B. And D tells us the charactor of the matrix.
D is also calld "pattern".
Matrix Decomposition is one of the kinds of
Cluster Analysis
.
It is intersting that
the clusters are both for A and B.
So meaning of the clusters is the sumary of the relationship between A and B.
In the field of Text Mining , the pattern is called topic.
Singular value decomposition (SVD) is used as the method of matrix decomposition as classical way.
This method is called "LSI" or "LSA" (Latent Semantic Indexing or Analysis", in the field of text mining.
In RapidMiner, SVD is put as the similar method of Principal Component Analysis (PSC) and Self Organizing Map (SOM).
SVD has week points that appearing of negative values and over fillting of the model. So PLSI (Probabilistic Latent Semantic IndexingÅjand LDA (Latent Dirichlet Allocation) are developped.
They are the applicated idea of Factor Analysis and Bayesian Network .
Non-negative Matrix Factorization (NMF) is the method.
In some purpose of clustring, we have common factor that does not divided into clusters. NMF is good for this purpose.
And it is also the strong points of NMF that it is simple and we can challenge NMF by R easily.
The example of NMF by R is below.
Two pacages are need to be installed.
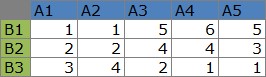
The code read the data in "C:/Rtest". And the file name of data is "Data.csv" The top and left side of the data is the name.
library(NMF)
library(dplyr)
setwd("C:/Rtest")
Data0 <- read.table("Data.csv", header=T, row.names=1, sep=",") # Input data
Data1 = as.matrix(Data0)
Pattern = Data1 %>% nmf(2) # NMF, Number of pattern is 2
PatternB = Pattern %>% basis # Make pattern of A
PatternA = Pattern %>% coef # Make pattern of B
PatternB
PatternA
write.csv(PatternB, file = "PatternB.csv") # Write csv file of A
write.csv(PatternA, file = "PatternA.csv") # Write csv file of B
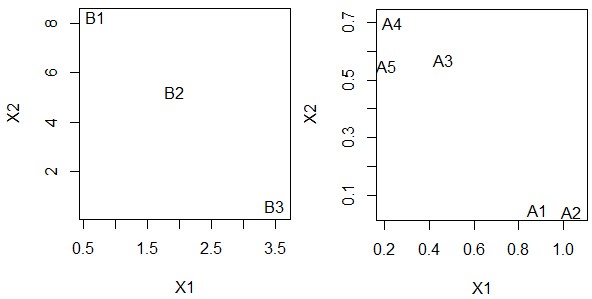
# Graph of PatternB
PBf1 = data.frame(PatternB) # make frame
PBf2 = data.frame(Name=rownames(PBf1),PBf1) # add Name to frame
plot(PBf2$X1, PBf2$X2,xlab="X1", ylab="X2", type="n") # make base of graph
pointLabel(x=PBf2$X1, y=PBf2$X2, labels=PBf2$Name) # plot data
# Graph of PatternA
PAf1 = data.frame(t(PatternA))
PAf2 = data.frame(Name=rownames(PAf1),PAf1)
plot(PAf2$X1, PAf2$X2,xlab="X1", ylab="X2", type="n")
pointLabel(x=PAf2$X1, y=PAf2$X2, labels=PAf2$Name)
NEXT  Q-Analysis
