Why LiNGAM is valid with normal distribution
In the Distribution for which LiNGAM is effective, it is concluded that "a normal distribution can also be used". However, since "NG" named " LiNGAM " is "Non-Gaussian (non-normal distribution)", it is strange that "it can be done with a normal distribution".
This page is a discussion of why you can do it.
The content of this page is my hypothesis. I think it's correct, but I'll fix it if I find something wrong in the future.
Why it is said that "LiNGAM cannot be used for normal distribution"
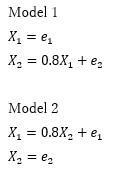
"There are two types, Model1 and Model2, and when you want to know which data you have, for example, when you have a uniform distribution, it is clearly different if you make a scatter plot, so you can distinguish it." Is common. In the example below, you can infer from the graph that Model1 is on the left and Model2 is on the right.
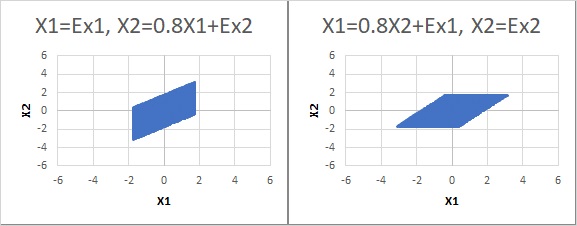
"On the other hand, if it is a normal distribution, it will be a similar distribution, so it can not be distinguished. Therefore, LiNGAM is a theory that can be used for non-normal distribution."
Relationship between data and coefficients obtained by regression analysis
The explanation that "it cannot be identified as a normal distribution" is given to the appearance of the graph.
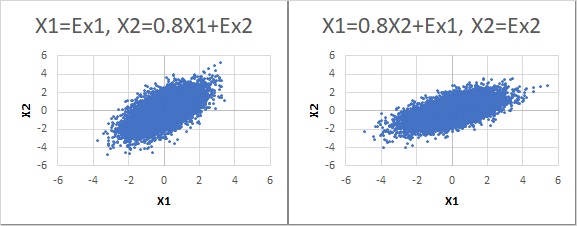
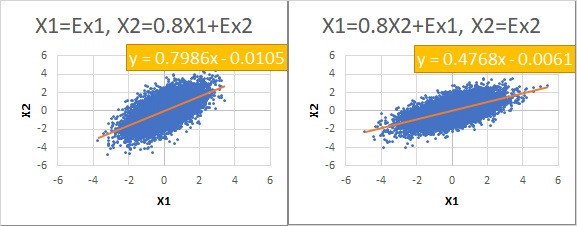
By the way, let's find the regression equations for each of the two scatter plots with a normal distribution.
Then, on the left side, the coefficient of inclination became about 0.8, and on the right side, it became about 0.5.
The same number "0.8" was found only on the left side.
Why the coefficient values are different
When applying the data created by the Model1 formula to the formula,

the form of the Model1 formula corresponds to the shape of this formula, so "a" can be obtained to be about 0.8.
On the other hand, when applying the data created by the Model 2 formula to the formula,
the form of the formula does not correspond. In this case, "a" is about 0.5 because the unmatched part is included in the calculated value of "a".
By the way, there is a similar story in
Measurement Errors in Regression Analysis.
Why LiNGAM can be used with a normal distribution
Similarly, when applying the data created by the Model 1 formula to the formula,

it becomes necessary to adjust the parts that do not correspond, and a becomes about 0.5.
The effect of self-alignment appears in the form of "a becomes smaller".
When the author investigated, it was decided that if the standard deviation of e is 1, the effect of the alignment is "a becomes smaller". When I tried the method, the standard deviation of e was 1, so this condition was true.
In the figure below, when e is 1, the horizontal axis is a created in Model1 and the vertical axis is the difference between a in the two models. Since the difference value is only positive, you can see that a is always large in the case of Model1.
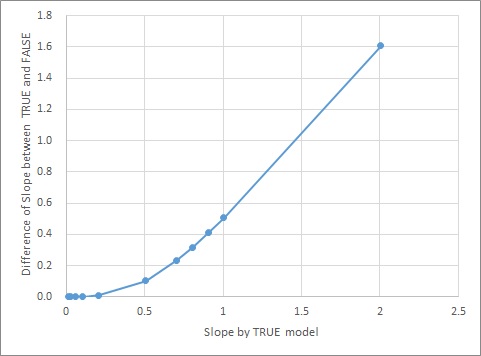
Therefore, if we do not know whether the original data is Model1 or Model2, it is estimated as a model formula if the absolute value of a is large.
If the original data is Model1, comparing
the time with the time,
the absolute value of a can be obtained more in the former, so the correct answer is the former.
The LiNGAM algorithm adopts the one with the larger absolute value as the coefficient of the estimation formula and sets the other to 0.
Therefore, it is considered that the algorithm can estimate the structure of the correct answer even with a normal distribution.
NEXT  Limit of LiNGAM
