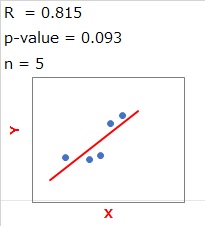
In the figure above, the number of samples is 5. The correlation coefficient is 0.815, and if you look at the scatter plot, it is roughly aligned.
Hypothesis Testing is also found in the correlation coefficient.
Here, we use a p-value of 0.05 (significance level of 5%) as a guideline to see if it is greater or less than that.
In the figure above, the number of samples is 5. The correlation coefficient is 0.815, and if you look at the scatter plot, it is roughly aligned.
In such a case, it is helpful to say that the p-value is 0.093, which is greater than 0.05 when making a judgment that "there may be a correlation, but it may be dangerous to make a definitive judgment" without immediately concluding that "there is a correlation!"
In this way, even if the correlation coefficient is large to some extent, the p-value is helpful when you want to be cautious.
When the number of samples is 1000 and the correlation coefficient is 0.1, the scatter plot is below.
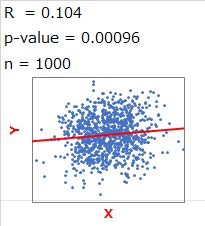
Looking at this diagram, I don't think anyone thinks that X and Y have any meaningful relationship, but if you understand that a small p-value means something, you will think, "There must be some meaning."
In other words, it is not possible to use it as "the p-value is very small, so the correlation coefficient is small, but there is some meaningful relationship".
The figure below shows how the p-value changes depending on the number of samples.
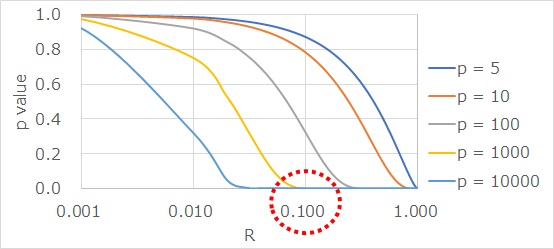
If the number of samples is 1000, you can see that the p-value is quite small even when the correlation coefficient is 0.1.
NEXT  Single Regression Analysis
