 Rによるデータ分析
 Rによるデータ分析
回帰分析系で高次元を2次元に圧縮して可視化 や 「残差の外れ値」 の、Rによる実施例です。
例のデータは、1列目の変数が目的変数Yです。 1行目以外のデータは、説明変数の足し合わせに誤差を加えて作っています。1行目のデータだけ、Yはこの計算を使わないで適当な値を入れています。
以下では、4つの回帰分析系を使い分けられるようにしてあります。 AutoML でできると、面白いかもしれません。 なお、下記のコードに入っている「automl」というのは、ニューラルネットワークのパラメータ調整を自動でするパッケージです。automlを使うと、ニューラルネットワークについては、autoになるのですが、他の手法をいろいろ試す方法にはならないです。
setwd("C:/Rtest")
library(ggplot2)
library(plotly)
Data <- read.csv("Data.csv", header=T)
Data1 <- Data
label_column <- 1# 1列目にY(目的変数)、これ以外は説明変数になる
Y2 <- names(Data1[label_column])
Y2data <- Data1[,label_column]
Data1[Y2] <- NULL
Data4<-cbind(Y2data,Data1)
#以下で、モデルの作成
Dimension_Reduction_Method2 <- 1 # 1=回帰分析、2=モデル木、3=SVR、4=ニューラルネットワーク
if(Dimension_Reduction_Method2 == 1) {
two_demension_model <- step(glm(Y2data~., data=Data4, family= gaussian(link = "identity")))
} else if(Dimension_Reduction_Method2 == 2) {
library(Cubist)
two_demension_model <- cubist(y = Y2data, x=Data1, data = Data4, control=cubistControl(rules = 5))# 5は、ルールの数の最大値
} else if(Dimension_Reduction_Method2 == 3) {
library(kernlab)
two_demension_model<- ksvm(Y2data~.,data=Data4,type='eps-svr', kernel="rbfdot")
} else if(Dimension_Reduction_Method2 == 4) {
library(automl)
two_demension_model<- automl_train(Data1,Y2data)
}
#以下で、予測値の計算
if(Dimension_Reduction_Method2 == 4) {
s2 <- automl_predict(two_demension_model,Data1)
} else {
s2 <- predict(two_demension_model,Data1)
}
Data6 <- cbind(data.frame(Y2data,s2),Index = row.names(Data))
#以下で、グラフ作成
ggplotly(ggplot(Data6, aes(x=Data6[,1], y=Data6[,2],label=Index)) + geom_text() + labs(y="predicted",x="label"))# 散布図を出力
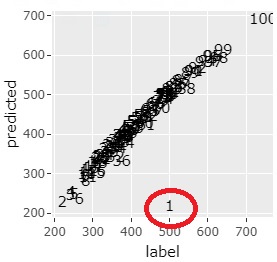
「残差の外れ値 の分析は、以下を加えます。 グラフ作成の例は、2種類です。
Y1 <- s2 - Y2data# 残差の計算
ggplotly(ggplot(Data, aes(x=Y1)) + geom_histogram()+ labs(x="predicted - label"))# ヒストグラムで残差を出力
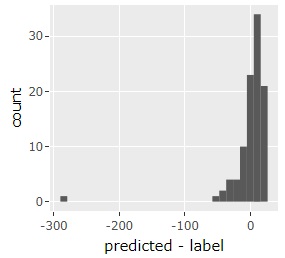
ggplotly(ggplot(Data, aes(y=Y1)) + geom_boxplot() + labs(y="predicted - label"))# 箱ひげ図で残差を出力
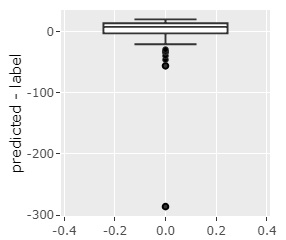
回帰分析やモデル木では、シンプルなモデルができます。 どのようなモデルになったのかは、下記で確認できます。
summary(two_demension_model)
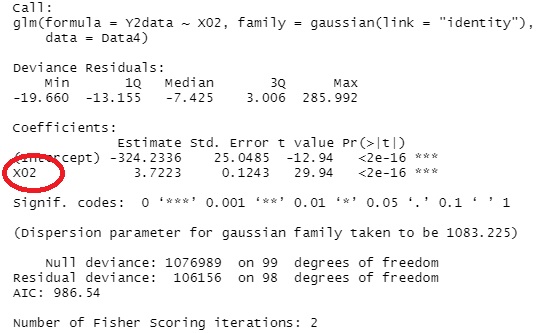
この例では、X02という説明変数だけでモデルができたことがわかります。
automl
CRANにあるマニュアルです。
https://cran.r-project.org/web/packages/automl/automl.pdf

