Data science is an important tool at key points in problem-solving and task-achieving procedures .
The most important usage is as a way to quantitatively express problems, the magnitude of effects, the strength of causal relationships, and so on.
You can also use it as a way to collect linguistic information or find information that you can't think of just by thinking about it.
The following is an explanation that follows the procedure for problem solving , but the idea is the same for achieving a task.
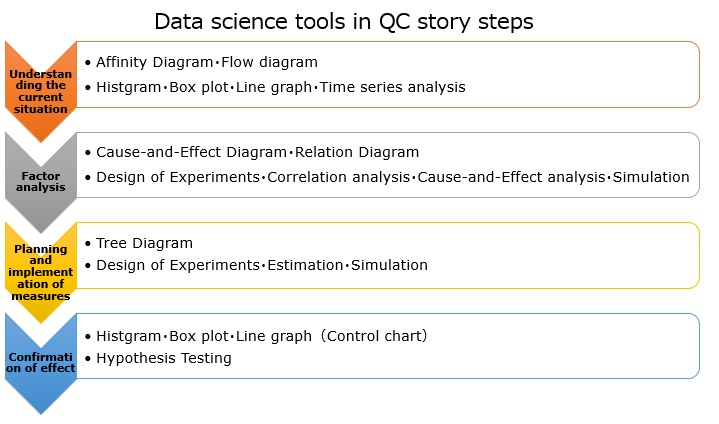
This is an analysis to find out from the data what kind of data is it, what is happening, and how it is happening. In some cases, just knowing these may eliminate the need for the next factor analysis.
The details of grasping the current situation can be found on the page for distinguishing between grasping the current situation and factor analysis, but if you want to improve the yield (non-defective rate), check the yield, and if you do not improve the productivity, check the productivity data in detail.
Suppose you have tabular data with up to 100 rows and up to 2 columns.
For such data, create a histogram , box plot , line graph , etc. and graph the data to get a good idea of ??the current situation.
If the data is larger than this, various techniques of data science will be useful.
When the number of lines is very large, if you make a line graph normally to see how it changes over time, it will be a messy graph that you do not understand well, or the processing of the PC will be very slow. there is.
Also, when there are many columns, it is difficult to look at each column.
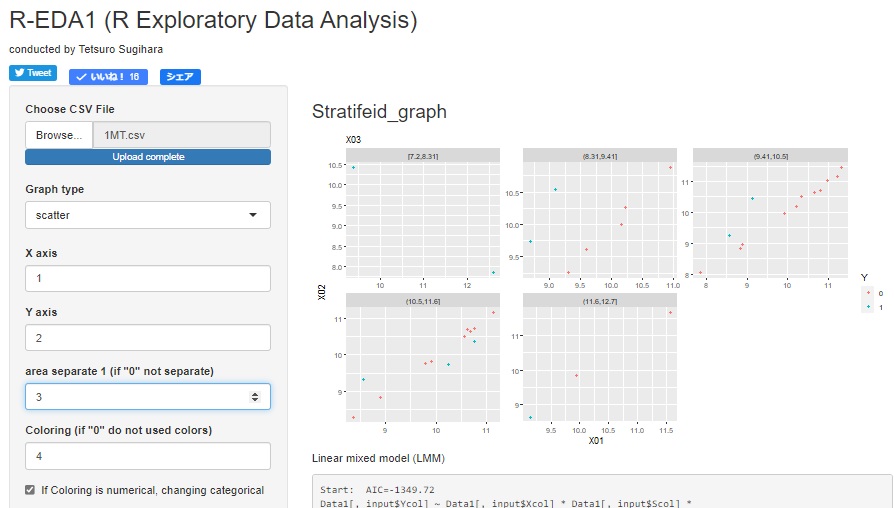
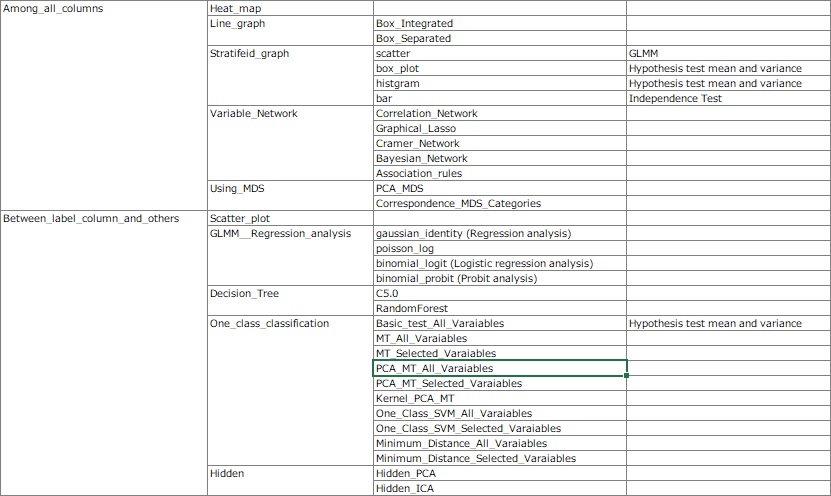
I don't know if it can be called "data science", but there are graphs that can visualize the entire data. On this site, the specific methods are introduced on the pages of Visualizing the entire data with Excel, Visualizing the entire data with R, and Visualizing the entire data with Python . Also, with R-EDA1 , various graphs can be easily created with the GUI. You can easily create a graph for each layer .
First, use sampling and use metaknowledge and feature engineering techniques to reduce the amount of data.
This can reveal important information.
Examples of this site include pages for analyzing quasi -periodic data with R and analyzing quasi-periodic data with Python .
The above method is a time series analysis in a broad sense . This is useful when it is important to understand the changes over time, such as when the data is arranged in chronological order or when the date and time data is included.
When it is not important to understand the changes over time, a sample grouping analysis or a many-to-many analysis can be useful.
Examples of this site include the page for analyzing sample similarity with R and analyzing the similarity between items for row and column items with R.
Make causal inference in a broad sense .
There are various difficult theories for "causal inference" as an academic discipline, but instead of using such theories, "things with similar timing of change" and "increase / decrease" are used for the data viewed in detail by grasping the current situation. Look up "something similar" from the data.
The methods that have been often used in the past are the search for qualitative hypotheses such as why-why analysis, association diagrams, and characteristic factor diagrams , and the verification (empirical analysis) of hypotheses based on regression analysis . Since the beginning of the 21st century, data science has been able to make a great contribution as a method for exploring quantitative hypotheses .
For small data, you can use a two-dimensional scatter plot or regression analysis , but for big data, it may become difficult to understand what you should see, or the PC may not be able to process it.
Also, it is difficult to see innumerable combinations of two variables.
Analyzing variable grouping and grouping individual categories can help you understand the overall relationship.
Examples of this site include R for variable similarity analysis , Python for variable similarity analysis , and R for individual category similarity analysis .
Also, although I rarely use it, there is also a hidden variable search as an analysis method unique to data science . Examples of this site include the Hidden Variable Analysis page in R and the Hidden Variable Analysis page in Python .
Among these methods are multivariate analysis and machine learning models. However, I use it to create a highly accurate inference model (prediction model) and examine the structure of the data, not to make it part of the deliverable. This kind of usage is rarely introduced, but it is an advanced usage of how to see the relationship of variables with a scatter plot or a correlation coefficient.
R-EDA1 's "Similarity_of_Variables_and_Categories" contains various analysis recipes that combine models and graphs. There are "data science software for factor analysis" in the world, but I don't think there is anything else that contains so many recipes.
In factor analysis, it may be good to actually experiment to search for and test hypotheses.
The experiment itself is not data science, but in order to carry out experiments efficiently , it is better to know the design of experiments , and it is better to have knowledge of errors , and these are data science.
There is a simulation as a method of experimenting in a computer instead of an actual experiment .
In simulation , the model used is sometimes a model for multivariate analysis or machine learning .
Knowledge of data science is also useful for preparing data and interpreting results when modeling physical laws as mathematical modeling .
Since the error is not generated by aiming, it is difficult to realize and analyze it. However, for quality problems in the manufacturing industry, error analysis is required.
The theory of error is not a major data science , but if the error can be accurately decomposed and quantified, it will be a great success as a factor analysis. The author himself has tested the hypothesis by combining mathematical modeling and error propagation, and by using iterative error estimation by double measurement .
Some theories of causal reasoning try to draw causal conclusions from data alone.
However, if you try to use this in practice, it will be logical and it will be difficult to get the cooperation of the people concerned, or "This data may be the conclusion, but it may not always be the case." , And so on.
On the other hand, it is much faster to perform a simple experiment or take a few measures to confirm the correctness of the hypothesis than to complete the process from the data you have to the verification of the hypothesis. In many cases, the hypothesis can be tested with certainty.
As in the case of factor analysis, there are times when experiments and simulations are conducted to consider countermeasures and measures, so data science is useful at this time.
As you can see on the countermeasure planning page, the practically best countermeasures and measures are often unrelated to data science.
By the way, for example, if you can create an expression that expresses the judgment method , it will be a measure such as "change the judgment by humans to the automatic judgment by artificial intelligence (AI) " . If you're like a data scientist, you might want to put these strategies first, as the theory of data science comes into the final output. However, it is better to think carefully about whether it is really the best policy when considering various points of view such as labor, time, effect, and price.
In the effect confirmation, basically, the data at the time of grasping the current situation and the data after implementing the measures are compared, and it is judged as "Is there any effect?"
When the number of data is large, it is obvious to arrange the graph of the one-dimensional distribution before and after the countermeasure.
It is good to combine the test and the one-dimensional scatter plot . In addition, there is a control chart as a method to confirm that the effect lasts and to notice when it does not last . The web application R-QCA1 has a test and control chart tool to see the difference before and after the countermeasure .
When you study data science, you may feel like you can solve things with data alone. This feeling is well understood by the author, but no matter how much data you look at or how advanced analysis methods you use, that alone will not lead to problem solving or task achievement .
One of the reasons why data science alone cannot solve the problem is that the data we handle is often "biased" or "does not represent the phenomenon itself." Even in this situation, it is necessary to extract as much information as possible to solve the problem without saying "this data is useless". If it is the data of the site that you are dealing with for the first time, you can solve it by understanding from the data such as "What is the usual site like?" And "What is this data recorded for?" Get closer.
When studying data science, you may be concerned about data deficiencies such as "insufficient numbers", "large variability", and "mixed outliers and missing values". Of course, there are some points like this, but the difficulty in solving the problem is that it is "biased" or "does not represent the phenomenon itself." "Biased" or "does not represent the phenomenon itself" may not be known without understanding the background of the data. You may notice it after a while after the countermeasures are completed.
Even in situations where "biased" or "does not represent the phenomenon itself", we will proceed to solve problems that need to be solved.
In the explanations of the world, there may be most cases where the solution to the problem can be seen from the data representing the phenomenon.
However, in actual problems, it is not uncommon to go to see data that is different from the previous stage at the stage of grasping the current situation, analyzing factors, and planning countermeasures. Therefore, one data set and the method of handling it will not lead to problem solving.
To reiterate at the beginning , data science will be used as a tool for the purpose of problem solving and task achievement . The connection between each stage is not data science.
We aim to reach these goals by using data science at key points in problem-solving and task-achieving procedures .
The image of data scientists in the world seems to be taking root as "people who are good at Python" and "people who can make highly accurate models".
Who is the one who uses a small amount of data as a clue and uses his knowledge and experience about data to solve problems?
There is a sense of speed on the problem-solving and problem-solving page, but there are times when speed is important, especially when it comes to problem-solving.
It may be necessary to carry out the process from grasping the current situation to confirming the effect with a delivery date such as "within an hour" or "today". In such cases, it is advisable to identify where quantitative analysis is required and how accurate the quantitative analysis is, and prioritize them.
NEXT  Digital Transformation (DX)
