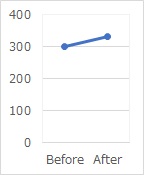
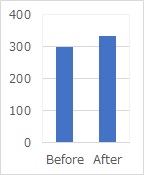
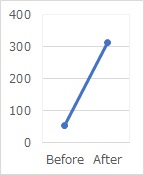
The data in the top two graphs is the same, the only difference is the type of graph. Both are graphs that show two types of data, before and after.
In the stage of confirming the effect, the results of countermeasure planning and implementation are known, so expectations and anxieties are mixed.
However, depending on the method of analysis, it may be inappropriate to confirm the effect. Here are some examples and how to analyze them appropriately.
The data in the top two graphs is the same, the only difference is the type of graph. Both are graphs that show two types of data, before and after.
It is common to show such a graph and report that it was effective. However, unless there are special circumstances, the appropriate interpretation is that "it is not possible to judge from these graphs."
Here's why: This is because, for example, you may be looking at a part of the case as shown below. The details are as follows, but if it is such data, it will be "ineffective". Therefore, it is not possible to make a judgment in the above figure, which compares single-point data.
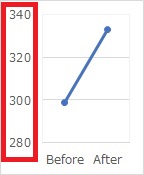
This graph has the same data as the first graph, but the range of the vertical axis of the graph is different. If the range of the graph is different, it looks like it has risen a lot. It is a graph that is easy to misunderstand that "the measures were effective".
Sometimes the feeling of "I want it to be effective" or "I want to report that it was effective!" comes first, and I make a graph like this. Also, even if you don't have such a feeling, you need to be careful because the software may automatically adjust the range of the graph.
Even if it is a comparison between one point, if the value is an order of magnitude different, or if it is extremely different before and after the countermeasure, it may be safe to say that it is "effective".
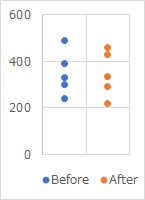
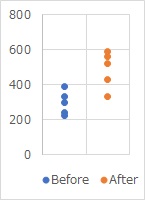
Preparing multiple data before and after countermeasures will make it clear how effective they will be.
If multiple pieces of data look like the one shown above, it can be said that it has no effect.
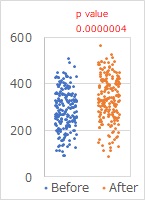
If you have knowledge of statistics, it is tempting to test the difference in means and conclude that the P value is small enough to be effective, but if you have a large number of data, you cannot make such a judgment.
If you collect multiple pieces of data and see a difference as shown in the figure above, you will be able to say that it is effective.
In the above, multiple data are prepared for each before and after the countermeasure. However, if you want to check the effect immediately after the measure, there may be only one piece of data.
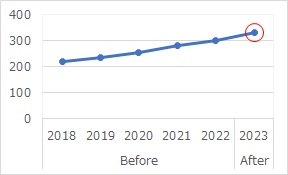
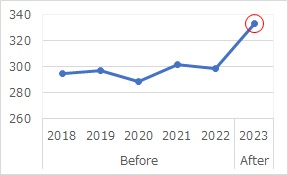
If you have time-series information, you will be able to make decisions even if you only have one piece of data after the countermeasure.
In the case shown in the figure above, the number of cases in 2023 after the measures is higher than in 2022 before the measures. Even before 2022, it seems that the rise has been continuing, and by extension, the value of 2023 is determined.
In such a case, it cannot be said that the value has increased due to the effect of the measures.
In the case shown in the figure above, after the countermeasures, the height is unthinkable from the changes before the measures.
In such a case, it will be "effective countermeasures".
NEXT  Standardization and establishment of management
