The easiest type of Self Correlation Analysis is to study the relationship between the step and previous one.
In this site, I call "Single Self Correlation Analysis" because Single Regression Analysis could be used to study this method.
Multi-Regression Analysis can do that Single Regression Analysis cannot do.
But Single Regression Analysis is used in the various stages of the data analysis because it is simple.
In the same way, Single Self Correlation Analysis is used in the various stages because it is simpler than AR Model and Others.
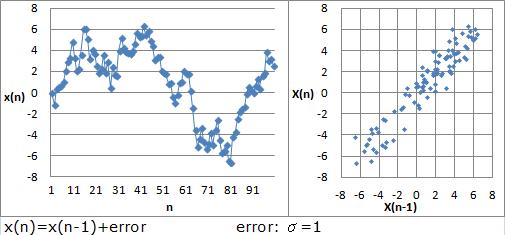
In the right scatter plot, values are made using the data of the line graph. X-axis is X(n-1). Y-axis is X(n).
In this scatter plot, the correlation between X(n) and X(n-1) is analyzed.
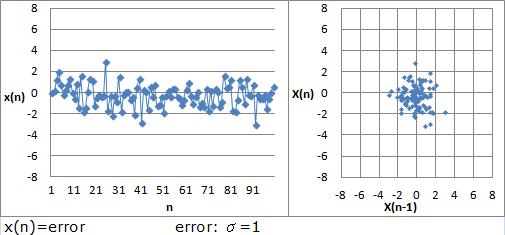
The plots are put like a straight line if self correlation is strong.
If self correlation is weak, plots do not show correlation.
If self correlation is strong, it means that "X(n) and X(n-1) are close values."
This simple fact makes applied use of single self correlation analysis.
"X(n) and X(n-1) are close values"
is
"Self correlation is strong = The values are linked continuously."
So self correlation could be used as the index of continuation.
This index is also used to check the time-depending factor in the data.
If self correlation is strong, we can do that
"Predicted value is equal to previous value."
For this use, the span of sampling is important.
For example, if the interval is 1 second, prediction for after 1 second might not be useful.
The data in the right figure has strong correlation not only between X(n) and X(n-1) but also X(n) and X(n-18).
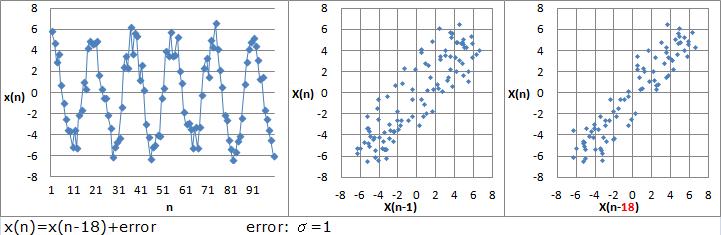
So there is the formulation.
X(n) = X(n-18) + Error
By searching the correlation, "n and n-1", "n and n-2", "n and n-3", etc, we can find periodicity.
In the right figure, "n and n-18" has strong correlation.
NEXT  AR Model and Others
