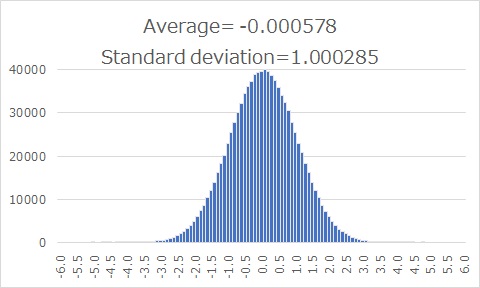
The histogram above is the same data as the Statistics page with a confidence interval of zero.
In Statistics with zero confidence interval (Impossibility of statistics), "How capable is the measurement system made?" and "How many significant figures?" This information is extremely important.
It would be nice if we knew in advance, but I tried to think of an estimation method when this is not the case.
The histogram above is the same data as the Statistics page with a confidence interval of zero.
If you look at the histogram, it ranges from -6 to 6.
If you think like a Gauge R and R, it is enough to accurately measure about 0.1 increments in this range. Even one increment can be used to some extent.
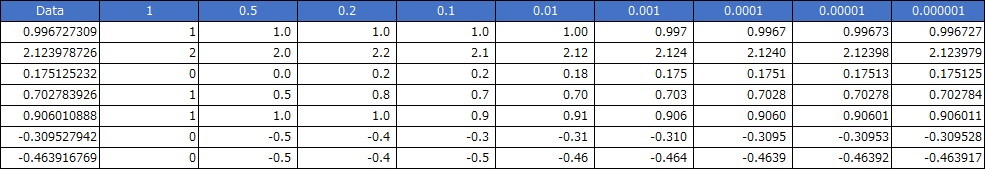
Suddenly, if there is data like the leftmost column, the right column is converted in one increment. For example, 0.996727309 becomes 1 in increments of 1 and 0.997 in increments of 0.001.
As an effect of Errors by Significant Figures, the variance is calculated in the graph below. The original data has a standard deviation of 1, so the variance is 1. From this graph, we can see that if the step is 0.2, the variance is less than 0.01. Since the original variance is 1, this means that when the step is 0.2, the effect of significant figure error is less than 1%.
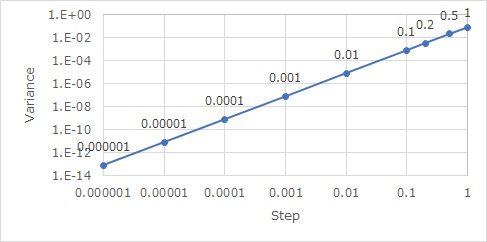
In other words, if the distribution has a standard deviation of 1, you can fully consider the state of the original data even if the step is about 0.2.
On Statistics with minimum confidence interval (Impossibility of statistics) page, there is talk about how accurate the data can be realistically obtained.
A system with a standard deviation of about 1 is sufficient, with increments of about 0.2. Also, as a practical matter, it is quite difficult to measure in increments of about 0.2 in a system where the standard deviation is about 1. It can be said that many measurement systems in the world have a good balance between the required specifications and the specifications that can be realized.
Therefore, even if there is a difference smaller than 0.2 in the calculation, it cannot be said that it is measured, and it will be 0 in terms of significant figures. Returning to statistics with zero confidence intervals, in such a case, it can be said that there is "no difference" without testing.
In Effect size of small data test, it says "0.8 is a big effect" and "0.2 is a small effect".
The effect size is the standardization of the difference in mean values by dividing it by the standard deviation so that you can refer to the knowledge of the distribution with a standard deviation of 1.
Therefore, 0.2 in the discussion of effect size is the same as 0.2 when the standard deviation is 1 and the step is 0.2 above. Therefore, the idea of using 0.2 as a guideline for the effect size corresponds to the case where the accuracy of the measurement system is high and the increments are about 0.2.
NEXT  Questionnaire
