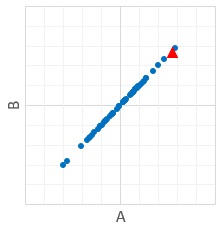
For example, there is a sctter plot. Blue plot is normal data. Red plot is the data we do not know the label.
Generally, red plot is estimated as "normal" because it is in the range of blue.
But some people think "Red might be abnormal" because it is in the edge of the range.
By the way, in this case, double measured data is not useful.
Red plot is in the range of both variables, A and B.
The point is that A and B have no correlation.
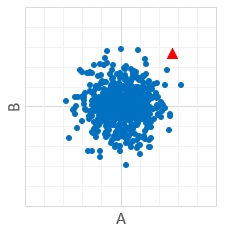
If A and B have correlation, "in the edge of the range of A" means "in the edge of the range of B".
But if A and B have no correlation, "in the edge of the both range of A and B" means rare case. Then estimation that "Red might be abnormal" is not bad.
Green plot is "in the center of the both range of A and B".
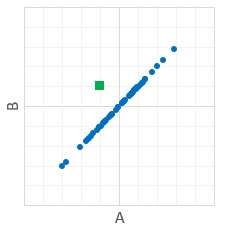
But green plot is the outlier of the distribution. So estimation that "Green is abnormal" is good.
We can estimate normal or abnormal for the double measured data by scatter plot. But it is not quantitative.
MT method and Single Regression Analysis are useful for the similar estimation.

