Residual Outliers
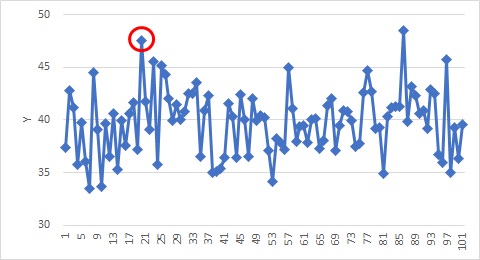
This page deals with outliers in the data shown in the figure above. If you write the correct answer first, only the data circled in red are abnormal values. Some of the data without red circles are higher than the data with red circles, but this is not an outlier.
This data does not reveal any "abnormalities", even using the methods on the page Outliers in Time Series Data .
In this example, the cause system is missing, but the result system data is not. Therefore, as far as this data is concerned, there are no "outliers."
How to use residual outliers
As an example of "the case where the cause system is out of line, but the result system data is not out of line", for example, "Due to some kind of fraud or mistake, the data should have been an outlier, but the data If the value is normal, there is ". Therefore, the method on this page is a method for detecting fraud and mistakes .
Prerequisite
If you only have the data in the figure above, you can't judge whether it's an outlier or not.
There are prerequisites for using the method on this page, and you need data other than Y. And it is necessary to create a relational expression with data other than Y and Y.
Residual error
Residuals are the differences between predicted and observed values.
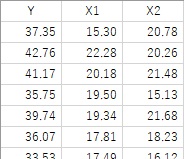
For example, if you make a relational expression
Y = X1 + X2
, the value obtained by putting X1 and X2 into this expression is the predicted value (Y'), and the Y of the original data is the actual value
.
By the way, in regression analysis , the coefficients of the model formula are calculated so that the residuals are minimized.
Residual outlier analysis
Finding the residuals for the example in the above figure results in the figure below.
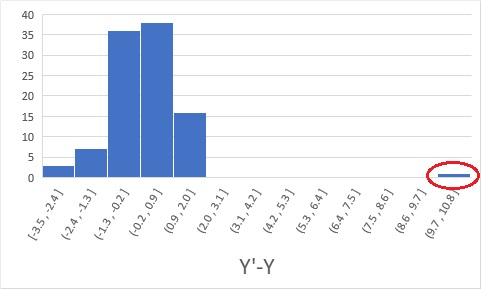
The residuals for the data circled in red are calculated as outliers. By doing this, I was able to expose it as an outlier.
The point is that even if both Y' and Y are normal values, the difference (residual) between Y' and Y is abnormal . Examining Y as an outlier investigation is rudimentary data analysis. Looking at Y' as well is a higher level of data analysis. I think that checking the difference between Y' and Y is an even higher level of data analysis.
Know-how on how to create residual models
As in the example in the figure above, if you already have data and want to check that there may be fraudulent data in it, a supervised learning model such as regression analysis is the best fit. The procedure is to select one and look at the distribution of residuals.
In other cases, such as "I want to find out if this data is bad" or "I want to check if new data is bad", we have the know-how.
Instead of creating a model with all the data, including the data you want to check, and then examining the residuals of the data you want to check, you can create a model with only the data you consider "normal" and then transfer the data you want to check into the model . to examine the residuals .
By doing this, if anomalous data is included, if this data is included in the model creation, it will be well included in the model, and the value as an "outlier" tends to be small. have the effect of preventing In addition, if abnormal data is included, the accuracy of the model will deteriorate, and there is a possibility that the model cannot be created, so this is effective in preventing this.
By the way, this know-how is similar to the idea of ??the one-class model . Also, the method of exposing anomalies by the magnitude of residuals is similar to anomaly detection by autoencoders . The difference between the method on this page and these methods is that the objective variable is quantitative data.
Software
Excel
Outlier Analysis of Residuals by Excel
is the example to use residuals by Excel
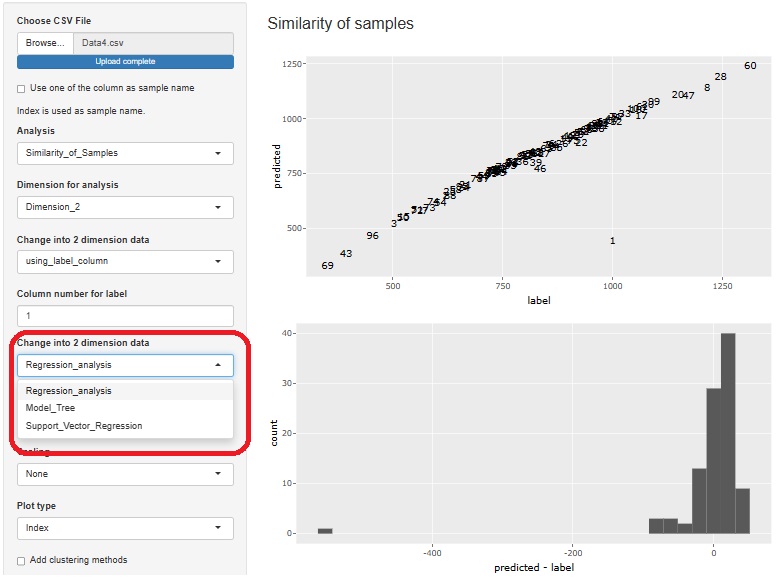
R-EDA1
R-EDA1
is also used for this analysis.
Regression Analysis
,
Model tree
and
Support Vector Machine
can be used.
NEXT  Measurement
