Analysis of Residual Outliers can be done not only by Regression Analysis , but also by any supervised learning method in which the target variable is quantitative data, and the results differ depending on the method.
If you try to get the residuals in R, Python, etc., it's not a standard output, so it's a bit of a hassle.
On the other hand, although it is limited to regression analysis, if you want to obtain the residual of regression analysis, you can easily do it with Excel.
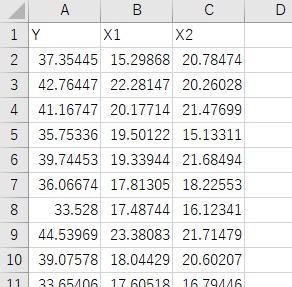
The data in this example has 100 samples and two explanatory variables, X1 and X2.
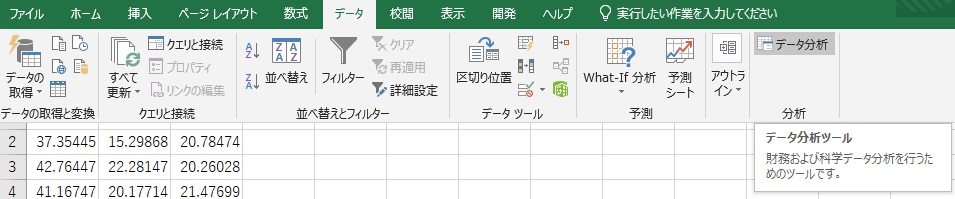
Select "Data Analysis" under "Data". (If you don't have it in your Excel, you can add it in the add-in settings)
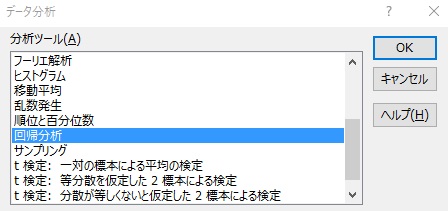
Select "Regression Analysis".
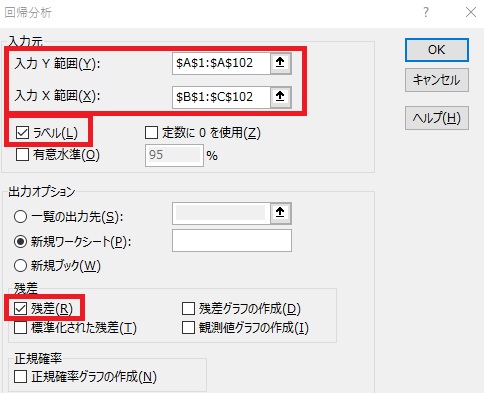
Enter your information. Here, the range includes the variable name in the first row of the data, so check "Label". I also check "residuals" because I want to output the residuals.
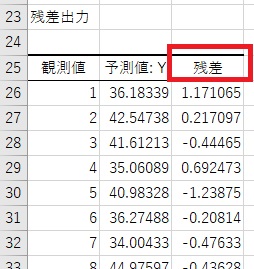
"Residual" is output at the bottom of the regression analysis results.
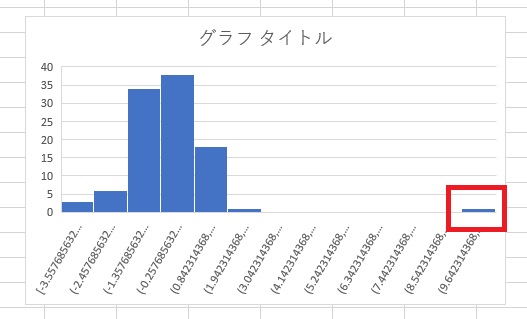
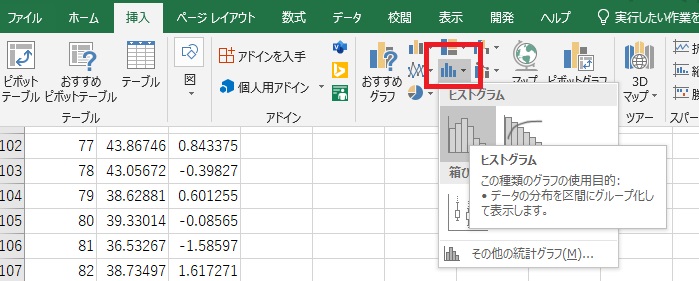
Select "Insert" and "Histogram".
For this data, you can also see how there are outliers.
