The point of the Model of Abnormal but not Outlier is how to define normal, but if the data has time series information, that information can be used.
If there is an Single Self Correlation Analysis, it means that some data is close to the "data before one step" or "the data after one step" .
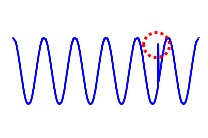
For example, anomalies visible in the data shown in the figure below can be treated as outliers by calculating the difference from the "data one step before".
For data like the one above, we can assume a "SIN curve". In this case, it is possible to calculate the predicted value that "if it is a SIN curve, it should be this value at this time".
This expected difference is small in areas other than the areas considered to be abnormal, and large in areas considered to be abnormal, making it possible to use outlier determination methods.
There is an anomaly that "the anomaly is manifested in a change in the relationship between variables". For example, "two variables that are normally uncorrelated are correlated when they are abnormal".
In the case of such an anomaly, it may not be possible to express the anomaly well by the method of processing separately for each line.
In such a case, if you use Moving Analysis to create relationship data, you will be able to use the outlier judgment method as an outlier in the relationship.
Traditionally, in the field of Quality science , SPC (statistical process control) has been developed.
Control Chart of the method defines how to detect an abnormal state for one variable.
As a way of thinking, it is judged whether it can be said that the way of increasing and decreasing values ??is generated from the same population.
Outliers are one such type, but many other types of anomalies have been devised. "When higher than the average value, it is continuous", "It goes back and forth above and below the average value".
NEXT  Residual Outliers
