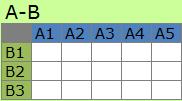
The factors of A and the factors of B have one to one relationship in
A-B Type.
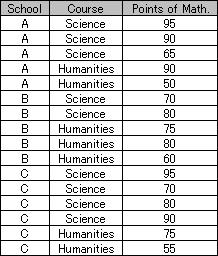
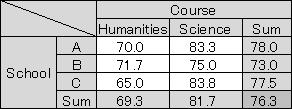
Data in Contingency Table is quality data. If quantity data is added, we can analyze widely using not only frequency but also average, sum, max, min, standard deviation etc.
Cross Tabulation uses Stratified Sampling.
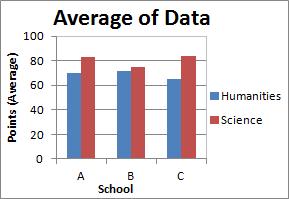
We can see the important points of the data.
Cross Tabulation is the main function of the software of BI (Business Inteligence).
Excel has "pivot table". By this function, we can use cross tabulation analysis easily.
NEXT  Matrix Decomposition
