In
Pattern Recognition
,
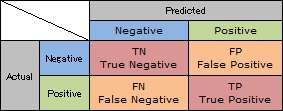
confusion matrix is used as the table of the output.
If the system is perfect, there values only in upper left and lower right space.

If the values only in lower left and upper right space, the system mistakes perfectly.

If "only in upper left" or "only in lower right", they are not perfect system.
In the real world, there are not enough data for 4 parts of the confusion matrix.
Differet fields use different ways for the evaluation with confusion matrix.
If
risk
is important, 2 types of risk is calcurated.
FP ratio = FP / (TN + FP)
FN ratio = FN / (TP + FN)
FP ratio and FN rario use same idea of Type I error and Type II error in Statistics .
FP ratio = FP / (TN + FP)
TP ratio = TP / (TP + FN)
This evaluation is used for screening. At screening, at first, TP ratio is maximized. Second, FP ratio is mimized.
ROC Curve and AUC are used for this evalation.
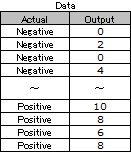
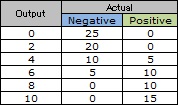
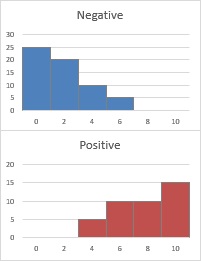
If there is a data set and histgram below.
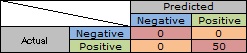
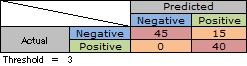
For example, if threshold is "3", confusion matrix is below.
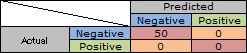
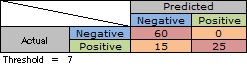
For example, if threshold is "7", confusion matrix is below.
NEXT  ROC Curve and AUC
