FP = (FP + TN)
TP = (TP + FN)
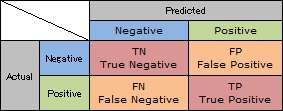
ROC Curve (Receiver Operating Characteristics Curve) and AUC (Area Under the Receiver Operating Characteristics Curve) are the tools to evaluate Pattern Recognition with Confusion Matrix .
They are used if we think, "At first, TP is maximized. Second, FP is minimized."
FP ratio and TP ratio are
FP = (FP + TN)
TP = (TP + FN)
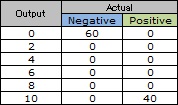
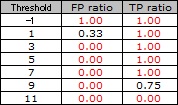
Examples TP ratio and FP ratio for threshold 3 and 7.
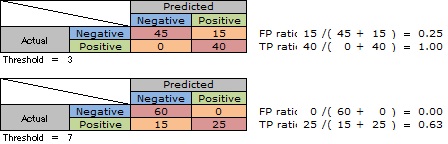
When threshold is 3, TP ratio is 1.
When threshold is 7, FP ratio is 0.
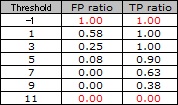
More examples is belos.
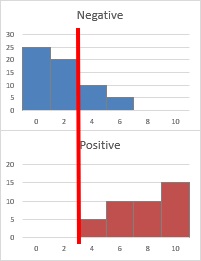
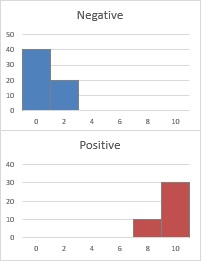
Histgram is useful to understand the meaning that "threshold is the best".
Scatter plot of TP ratio and FP ratio is called "ROC Curve".
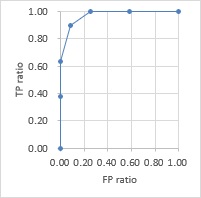
If we get ROC Curve like below, we can get perfect pattern recognition system.
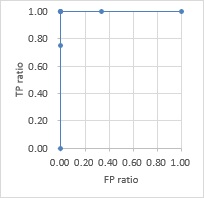
When ROC Curve is the perfect pattern, Area under the curve is 1.
The are is used to evaluate the level of pattern recoginition. It is called "AUC".
AUC is from 0 to 1.

