"Let's use Multi-Regression Analysis because Y is one and X is multiple.", so even if you use multiple regression analysis, the results that can be output are often the same as Single Regression Analysis.
Knowing what time is different from the results of a single regression analysis can help you see and show the results.
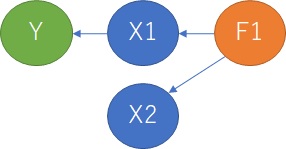
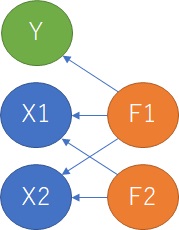
As you can see in the figure below, Y is the objective variable and X1 and X2 are the explanatory variables. F1 and F2 are called latent variables in factor analysis , and although they are not included in the data, they are the factors that cause the increase or decrease of the data.
The causal relationship is when X1 and Y have a causal relationship, and even if X2 and Y do not, the factors of X1 and X2 are common.
In this case, in simple regression analysis, not only the correlation between X1 and Y is high, but also the correlation between X2 and Y may be high, so it is necessary to judge which is the true causal relationship from the data alone. Is difficult. You can determine which one it is by the magnitude of the correlation coefficient, but the suspicion remains that "this data may be, but I don't always know if it will be."
When there is a suspected correlation.
In simple regression analysis, you can create a model for each combination of Y and X01 and Y and X02. Even in multiple regression analysis, any combination of Y and X will result in a model that does not change much.
The two X factors are different, and Y is the linear sum of X.
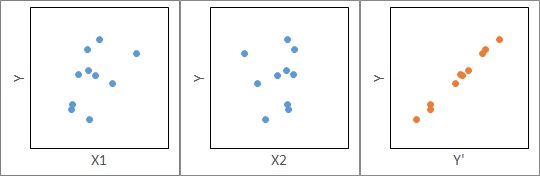
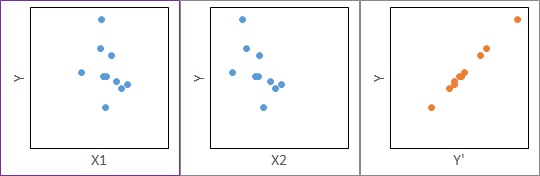
In this case, for example, if you look at the scatter plot with a combination of X1 and Y and X2 and Y as shown in the figure below, none of them may appear to be correlated.
If you build a model with multiple regression analysis and calculate Y', the estimated value of Y, with the regression equation, you may see a very high correlation between Y and Y'.
In this case, the simple regression analysis alone leads to the conclusion that "Y and X are not related", but the multiple regression analysis leads to the conclusion that "Y and X are related". The elucidation of the mechanism will proceed.
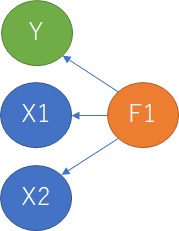
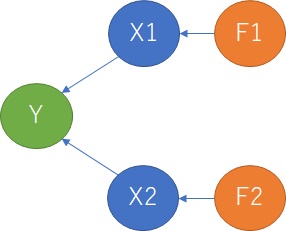
Two Xs and two factors are the same as in the previous case, but each X is a linear sum of F1 and F2. Also, Y has a causal relationship with only one of F, but has no causal relationship with X.
Again, when looking at the scatter plot with a combination of X1 and Y and X2 and Y, none of them seem to correlate. The same is true for the different conclusions between simple regression analysis and multiple regression analysis.
However, the mechanism behind X is different from "when the two factors of X are different".
In this case, if the influence of F1 is large on X, the correlation between Y and X1 and Y and X2 will appear to be high, so the analysis will not be much different from the case of the above spurious correlation.
It's hard to think about when F1 has a small effect on X and is a hidden variables . At first glance, it is difficult to notice the underlying mechanism because the result of the multiple regression analysis does not change from "when the two X factors are different". You will notice when you check the coefficient values ??and signs of the multiple regression equation. The question arises, "Why is this a minus?"
When the influence of F1 is small with respect to X, by adjusting the coefficient to cancel the influence of F2 contained in X1 and X2, the calculation is such that only the influence of F1 remains in Y'. Become. This will increase the correlation between Y'and Y.
NEXT  Principal Component Regression Analysis
