 Application of Suspected Correlation
Dot Graph and Correlation is used in decision making . It is important to check the background of the data.
By this check, we often find the misleading by the correlation. But this notice is the start of the next stage of the analysis.
Outlier affects strongly the value of correlation coefficient. We have to check that we use valid data set.
The timing of sampling may affect correlation coefficient.
In this case, if we consider for example, "Normally there are no correlation, but there is correlation for some timing. Why ?", we may find the solution.
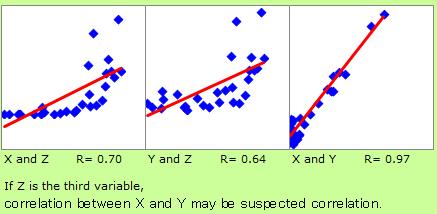
For example, do you think that there is a relationship between the height of children and the volume of words they know? The cause of the relationship is their ages.
This correlation is called "suspected correlation".
Suspected correlation is difficult to analyze. Statistics does not tell us the physical relationship between X and Y.
We can judge the age as the third variable by our knowledge. But we cannot judge in the case like the relationship in high technology and unknown phenomena.
It is also the case that we do not have the data of third variable. The worse case is that we do not know what is the third variable.
We may find the third variable by the consideration about the common fact of the two variable. I use suspected correlation in this way. Suspected correlation can be the start to the next stage of the data analysis.
Correlation coefficient measures linearity. If there is a lineality, relation is strong. But if relation is strong, linearity is not necessary.
NEXT Application of Suspected Correlation
