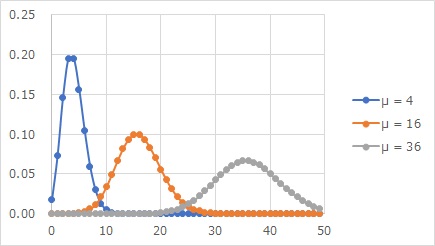
An example of the Poisson distribution is shown in the figure above.
Poisson regression analysis is a type of Generalized Linear Model. This is a regression analysis in which the residuals are Poisson's distribution.
An example of the Poisson distribution is shown in the figure above.
The Poisson distribution has only integers greater than or equal to 0. It is known as the distribution of data when counting rare phenomena.
One of the characteristics of the Poisson distribution is that the mean and variance are the same. The standard deviation is the square root of the mean. For this reason, the u in the above figure is the average value of each distribution, but it can be seen that the larger the u, the greater the variation. If the mean values are 4, 16, and 36, then the standard deviations are 2, 4, and 6.
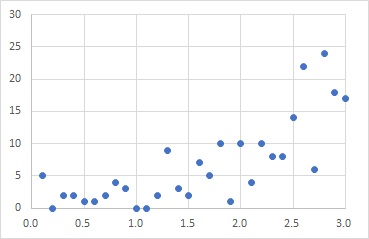
The perfect distribution for Poisson regression analysis is as shown above.
As X increases, the variability increases.
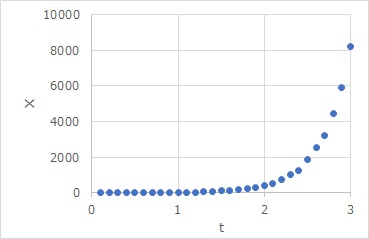
When performing a Poisson regression analysis on a generalized linear model, the default is not only to select the Poisson distribution, but also to select logarithms for the link function. In other words, it is common for Poisson regression analysis to take into account that the average value of Y increases exponentially for X. In the case of the above example, it would be better to think of it as exponential, not linear.
This seems to come from the fact that it is a phenomenon in the natural world that when we say "increase", it often increases exponentially, not linearly.
Poisson regression analysis is meaningful not only as a model in which the more X increases, the greater the variability, but also as a model in which the number of changes increases exponentially.
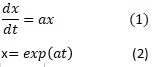
Model equation (1) expresses that the rate of increase in x is proportional to a times a of the value of x at that time. The relationship between x and t that applies to (1) is (2), which is an exponential function. For example, the graph looks like this:
In this way, when the mechanism of proportionality is behind it, what is visible may be an exponential function.
In the Poisson regression model, the link function is an identity function (Y=AX+B), and a href="ede1-2-1-1-4.html">Regression analysis of Proportional variance is a similar model.
In both cases, the larger the X, the greater the variation of Y.
The first difference is the difference in the shape of the model, and in the Poisson regression model, the characteristic that "the greater the X, the greater the variation" is included in the Poisson distribution. On the other hand, in the proportional variance model, the variation of the underlying distribution is fixed, and by multiplying it by X, we are dealing with "the greater the X, the greater the variation".
The Poisson distribution is a distribution of numeric values (integers greater than or equal to 0). Proportional variance models are not limited to counting data or being positive.
In the Poisson distribution, the square root of the mean is the magnitude of the variation. The average value is the average value at a certain X time.
The proportional variance model is proportional to X, with greater variability. Another difference is that it is not a square root.
e Poisson distribution can be approximated as a normal distribution when the mean value increases to a certain extent.
If we assume that the shape of the distribution is normal with proportional variance, when the mean value is small, the shape of the distribution of the residuals is different between Poisson regression and the proportional variance model. When the mean value is large, it is in the form of a normal distribution. As mentioned above, Poisson regression is a "square root", so the point of normal distribution is common, and only the size of the variation is different.
Poisson regression software can be found on Generalized Linear Mixed Model page.
NEXT  Multi-Regression Analysis
