As a method for investigating whether there is a difference between two ratios, Hypothesis Testing for Difference of Ratio is generally well known.
In this test, for example, "30/100" and "33/100" have a p-value of 0.76, which is the conclusion that there is no difference. Also, if "300000/10000000" and "303000/10000000" are "0/0000038", the p-value will be <>.<> and "there is a difference". No matter how small the difference in proportions, if the number of samples is large, the method is "significant".
Therefore, there are numerical values of two ratios, and it is a method to strictly check whether there is a difference. It is not a way to find out how likely the difference between the two ratios is. As a method of positioning the same way that there is a test of difference in normal distribution for the test of the difference in the mean value and a test of the difference in variation of the normal distribution for the test of the ratio of variance, the author devised the "test of difference in proportion distribution" on this page as a method of positioning.
I thought about two things. Both are similar to the two Test for Normal Distribution Differences.
Test for Differences in Proportional variances 1 (similar to Test 1 for Differences in Normal Distributions)
Mean difference / (standard deviation / square root of number of samples n)
Test for Differences in Proportional variances 1 (similar to Test 1 for Differences in Normal Distributions)
Mean difference / standard deviation
Test 1 for differences in proportion distributions follows the same idea.
In EXCEL, for example, if two ratios are entered in cells A2 and B2, the bellow formula will give you the p-value. The last "*2" comes from the fact that it is a two-sided test.
=(1-NORMDIST(ABS(A2-B2),0,SQRT(A2*(1-A2)+B2*(1-B2)),TRUE))*2
The normal distribution difference test can be represented by a graph with the p-value on the vertical axis if the horizontal axis is the effect size or has the same meaning, but if the standard deviation is fixed at 1 and the horizontal axis is the difference between the mean values. The test for differences in normal distribution variability can be represented by a graph with the p-values on the vertical axis if the horizontal axis is the ratio of the standard deviations.
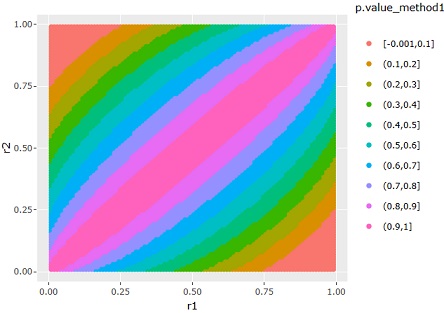
The difference in ratio distribution cannot be expressed by a single curve because there is no good measure such as effect size or ratio. Since there is a feature that the ratio value has a fixed range from 0 to 1, the graph below shows a graph of the p-value by taking advantage of this feature.
If the two ratios are the same, the p-value is 1, and the wider the difference, the lower the p-value.
The concept of Test 2 for differences in Proportional variance is the same as Test 2 for differences in normal distributions, but the point is the idea of Proportional variance.
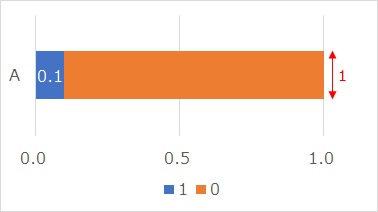
The Proportional variance is like the graph above.
The original data for calculating the ratio is only 0 and 1, for example, "90 0s and 10 1s". In this case, the ratio of 1 is 0.1, which represents the "0.1" part of the graph above.
In this graph, if the width of the band of the graph is considered to be "1", the area will be "1", and it can be used as a probability density function. The probability density function is generally expressed as a mountain-shaped distribution, but in the case of proportions, the probability density function can be represented in such a graph because the original data are only 0 and 1.
This representation of the ratio distribution was devised by the author. It may already be in the world, but I have never seen it. The content of this page, if any, will be adapted to it.
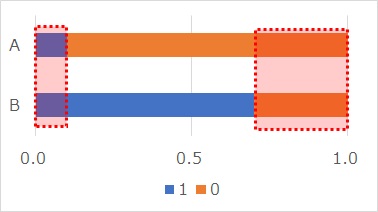
In Test 2 for Differences in Proportional variances, the idea of p-values is basically the same as Test 2 for Differences in Normal Distributions. The area of the intersection of two distributions is taken as the p-value.
If the two ratios are r2 and r1, and r2 is larger, the p-value is:
p value = r2 + (1 - r1)
In EXCEL, for example, if two ratios are entered in cells A2 and B2, the bellow formula will give you the p-value.
=1+MIN(A2:B2)-MAX(A2:B2)
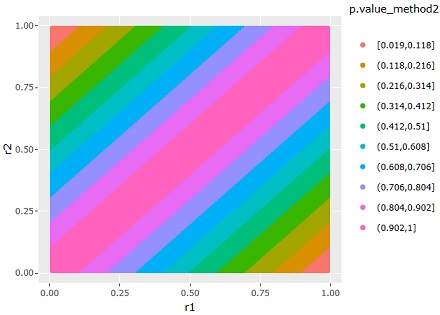
In the case of method 2, it is slightly different from method 1.
NEXT  Hypothesis Testing from 21 century
