ANOSS : Analysis of sum of squares
ANalysis Of Sum of Squares (ANOSS) has "sum of squares" in its name, but what we want to investigate is not the difference between sum of squares, but the difference in average values. A type of Hypothesis Testing for Diffrence of Average. ANOVA is similar to using variance to examine the difference in means.
In the sense of Hypothesis Testing from 21 century, it is a method that is intended to be used in conjunction with conventional analysis of variance.
The name ANalysis Of Sum of Squares (ANOSS) was given by the author. Sum of squares analysis is considered by the author as a Hypothesis Testing from 21 century equivalent to analysis of variance. If there is already the same thing in the world, I will match the name to that.
Calculating a Sum of Squares Analysis
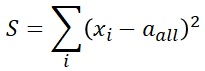
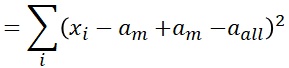
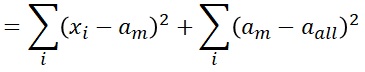
Xi is the sample value, all is the overall mean, and m is the average value of each group. Analysis of variance first divides the overall sum of squares into the sum of squares from the mean of each group and the sum of squares of the mean and the overall mean of each group.
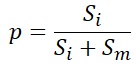
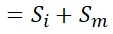
The equivalent of the p-value is the proportion of Si. The procedure is simpler than analysis of variance.
How sum-squared analysis works
Si represents the sum of the variability from the mean of the groups to which you belong for each sample.
Sm represents the sum of the variability from the overall mean for each group mean.
If each group is from the same population, Sm will be much smaller. If the populations of each group are different and the means are apart, the proportion of Sm will be large.
Features of sum-squared analysis
The size of the sum of squares is affected by the number of samples, but the p-value calculation calculates their ratio.
The accuracy of the p-value varies depending on the number of samples, but this p-value does not have the characteristic that "it tends to become smaller when the number of samples is large". This is the difference from ANOVA.
Calculation example
Here is an example of a calculation: ANOSS is the p-value for sum-of-squares analysis and ANOVA is the p-value for analysis of variance.
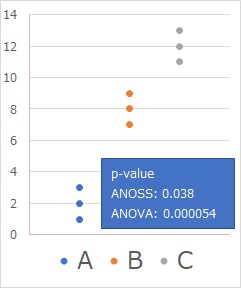
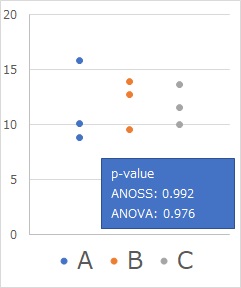
There are three groups, each with 3 samples. The difference between ANOSS and ANOVA is not that great.
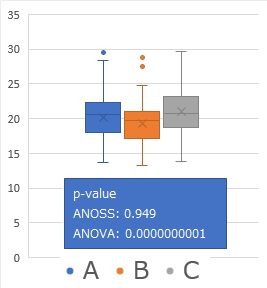
The number of samples is 100 each. The big difference between ANOSS and ANOVA is obvious. In practice, it is better to conclude that there is no difference in the average value of this size, but it is the sum of squares analysis that is such a measure.
NEXT  Paired t-test
