Difference of ratio in percentage is popular analysis.
By the way,
how we compare the meaning between
0.1 = 400 / 2000 - 100 / 1000
and
0.1 = 4 / 20 - 1 / 10
?
Hypothesis Testing for Difference of Ratio is used for this analysis.
prop.test(c(100,400),c(1000,2000))
In this example p-value is 6.145e-12. So we think it as "there is difference".
prop.test(c(1,4),c(10,20))
In this example p-value is 0.8625. So we think it as "there is not difference".
We can do similar analysis using significant figures .
The test of the difference in ratio can be done in one line in the case of R as described above. I think it is the easiest test that can be done with R.
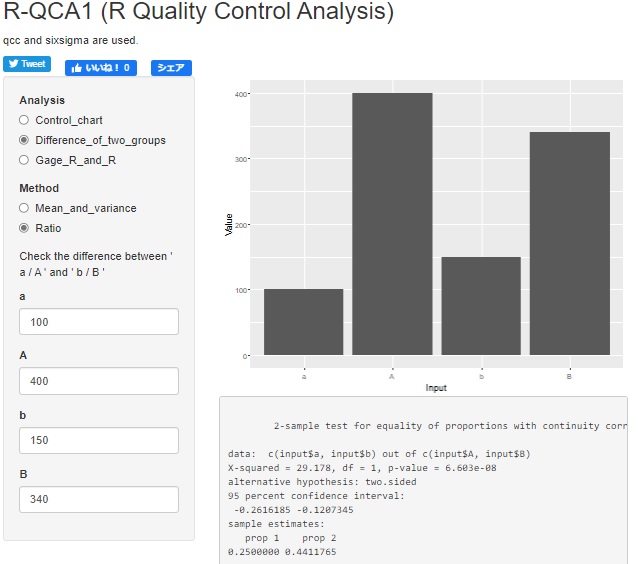
I thinkR-QCA1 is a good way to do it easily, such as on a computer or tablet that does not have R installed . Enter the required 4 numbers and you will get the result as a set with the graph.

NEXT 

 Test for differences in Proportional variances
