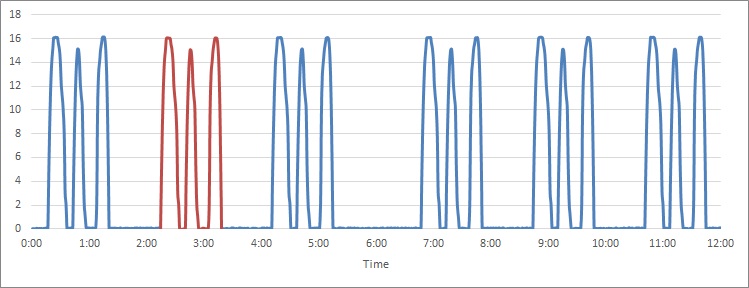
It is the data when three processes are performed for one product. Each mountain represents one process. For example, the graph below shows the data for 6 products. One set of three contains six sets.
I want to find out what is different from other times because the data when it is red is bad. Is it analyzed by Fourier transform?
The approach of Spectrum Analysis of Fourier Transformationn is not suitable for what you want to do .
This is the reason why it doesn't fit, but first of all, there is a point that the cycle does not seem to be constant. Also, even if we proceed with the analysis and start talking about frequency components, it is difficult to consider what is happening. Even if I can understand it, I think it is very difficult for the people involved to understand it and proceed with the subsequent development.
For three times in one set, for example, if the vertical axis is set to 1 as the threshold value and the coding is performed so that it is decomposed, the feature quantity can be created by dividing it. If you create a feature such as the maximum value of the first time, the time of the first time, and the time between the first and the second time, use the feature to explain the phenomenon and make the people concerned understand it. I can.
When studying Machine Learning , you may want to analyze this data as it is, or by using the data with three peaks for one product as one sample and applying the machine learning model. However, in such a case, the model can only capture "there are three mountains", and it may not be possible to capture the subtle differences among the three mountains. Even if it is captured, it is the same as in the case of Fourier transform, and it is difficult to develop it after that.
Analysis of Type 2 (Feature Data)
