Fishbone diagrams also one of the 7 QC tools .
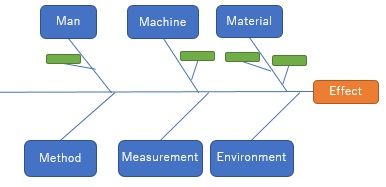
A fishbone diagram is aptly named to represent "characteristics" and "factors". It is often used with the idea that "characteristic = result" and "factor = something that can be the cause". Used infactor analysis.
Also, the first factor is categorized into 5M+1E (Man, Machine, Material, Method, Measurement, Environment), which makes it easier to think about what is happening in the factory.
Among 5M+1E, the measurement factor may be the most difficult to understand what to write.
In Measurement, we think that "measured data may not be correct" and "we measure and record data like this".
If we divide it from the perspective of 5M+1E, for example, we may get lost as to where to write "measurement by an operator" among Man, Method, and Measurement. As a result, it is good if it is a MECE analysis , so it is good if it is included somewhere. Also, although it's not MECE, even if there are duplications, it's better than there are omissions, so I think it's okay to include them all where they seem to apply.
Since I was in charge of guiding company-wide improvement activities, I have had a lot of experience using fishbone diagrams. In textbook explanations of QC, cause-and-effect diagrams are used for factor analysis. I have.
Based on that experience, it seems better to think of fishbone diagrams as "diagrams that show the structure of phenomena and things" rather than "diagrams that show causal relationships."
Once the structure is understood, it becomes possible to make a hypothesis of causal relationships. Therefore, it is a good idea to try it when you start to think about causal relationships and get confused.
If it is difficult to think of it as a fishbone diagram, it may be easier to think of it in the form of Why-why Analysis .
Also, when you want to comprehensively list the things that should be checked, it is better to write down what is happening in the Business flow in order.
NEXT  Association Diagram
