Systems Thinking (structural model of a system) is faster if you draw a diagram and connect those relationships with arrows and bars, rather than proceeding only in your head, saying, "This is what happened, this is what happened." It seems deeply integrated.
Broadly speaking, there are two types of diagrams: tree structures (tree models) and network structures (network models).
Common to tree and network structures is that each frame contains either a word or a simple sentence. It is a know-how to prevent the character string from becoming longer than that. When it's long, it's easier to spread the idea by breaking it down.
In the case of words, make sure that the connection of words has a meaning such as function.
It is suitable for expressing things such as "there is a center, an edge, and the middle" or "there is an upper part and a lower part". It is used in why- why analysis, fishbone diagrams , genealogy diagrams , mind maps, ontologies , pyramid structures , etc.
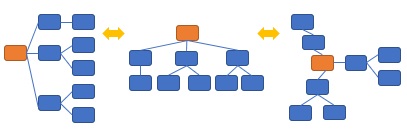
In the diagram below, the areas highlighted in orange are the things you want to clarify, the things you want to achieve, the results, the conclusions, and the recommendations. The blue part contains the means, reasons, and grounds for that.
In tree-structured diagrams, even if the content is the same, there are differences in how the items are arranged. The ease of thinking changes depending on how you arrange them.
If it spreads radially from the center, it is suitable for when you want to think freely from various points of view.
If the data spreads from top to bottom or from left to right, it is easy to think of things that have the same horizontal and vertical alignment, if you want to make the granularity of the content the same, or if you want to perform MECE analysis .
In tree-structured diagrams, even if the content is the same, there are differences in how the items are arranged. The ease of thinking changes depending on how you arrange them.
When combined with multivariate analysis, decision trees , path analysis , LiNGAM , etc. apply.
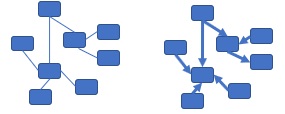
Suitable when the subject is in a flat relationship. There are diagrams, relationship diagrams , conceptual analysis , business flow , etc. used in system thinking in a narrow sense .
In the case of a tree structure, it is constructed as a figure that either spreads out from the center or moves toward the center. On the other hand, network structure does not have a center, so it is not possible to understand the overall structure of the diagram. Arrows may be used when there is a direction from something.
The content of arrows can be cause and effect (cause and effect) or the flow of things or information (input and output).
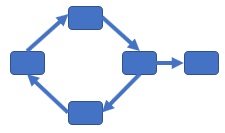
Network structures can also represent cases where there is a cycle in causality.
Graphical lasso , association analysis , etc. are applicable when connecting network structure with multivariate analysis .
Although it is in the structure of the data that becomes a directed graph, if there is a direction, the meaning of the data, the method of multivariate analysis, and the direction of the arrow will differ depending on the situation.
A mind map is a type of projection that organizes concepts (words) in a tree structure. In that sense, it is similar to a 5 whys analysis, fishbone diagram , and genealogy diagram .
The main features of the mind map, which are different from why-why analysis, cause-and-effect diagrams, and genealogy diagrams, are as follows.
Mind maps look just like edges. There are nodes as points to connect edges, but there is nothing in the nodes.
Many projections write words or sentences at nodes and give particular importance to this content. In many projections, edges can also indicate relationships, but edge can simply mean "causal".
In many projections, the nodes may contain sentences rather than words. Words are often nouns only.
In mind maps, each edge is a word, and verbs and adjectives other than nouns are also used.
As a know-how for why-why analysis, one node may be a simple sentence, and the reason and result may not be written together in one node. This is a trick to make it easier to think of other possibilities.
The mind map seems to push this idea to the limit.
Mind maps make heavy use of pictures and colors. This makes it easier to leave an impression and make it easier to come up with ideas.
Even in presentation materials, it is easier to convey to the other party with pictures and diagrams than with words alone, and mind maps are thorough in this respect.
There are benefits to expanding in one direction, but a mind map is omnidirectional. This makes it easier to come up with a completely different point of view.
When presenting ideas with MECE (complete and exhaustive), it is easier for me to think in one direction. If they are arranged side by side, it is easier to organize them, such as "when XX and when not XX" and "A, B, C that can be considered as a pattern".
Techniques such as "line graph" and "directed graph" can be freely taught to people, but there seems to be a system of "authorized" for mind maps.
NEXT  Concept Analysis
